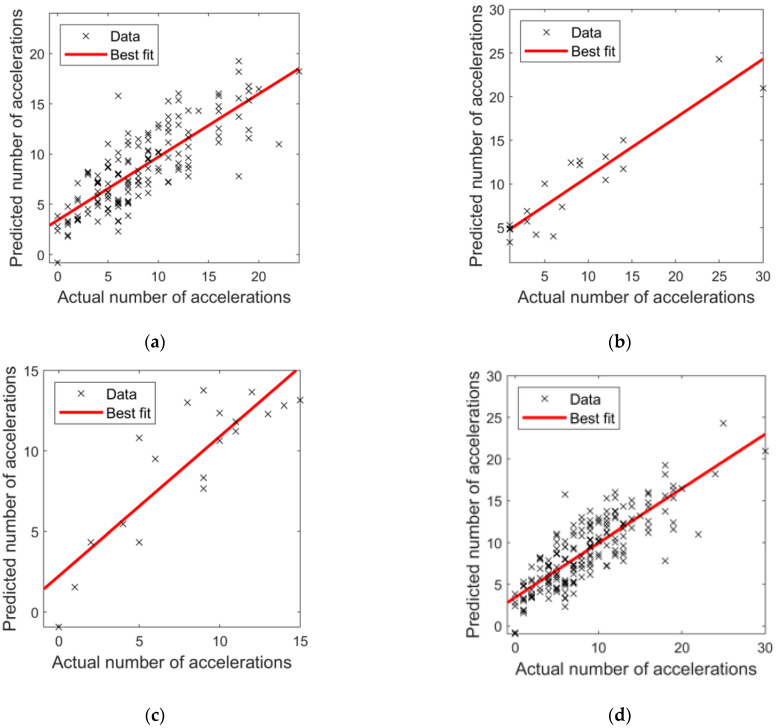
Figure 7.
Scatter plots of the number of actual versus predicted accelerations for (a) the training subset; (b) the validation subset; (c) the test subset; (d) all data sets. The fitting line (solid) is also reported for each plot along with the identity (X = Y) line (dashed), used as a reference to represent the perfect agreement between real and predicted data.

