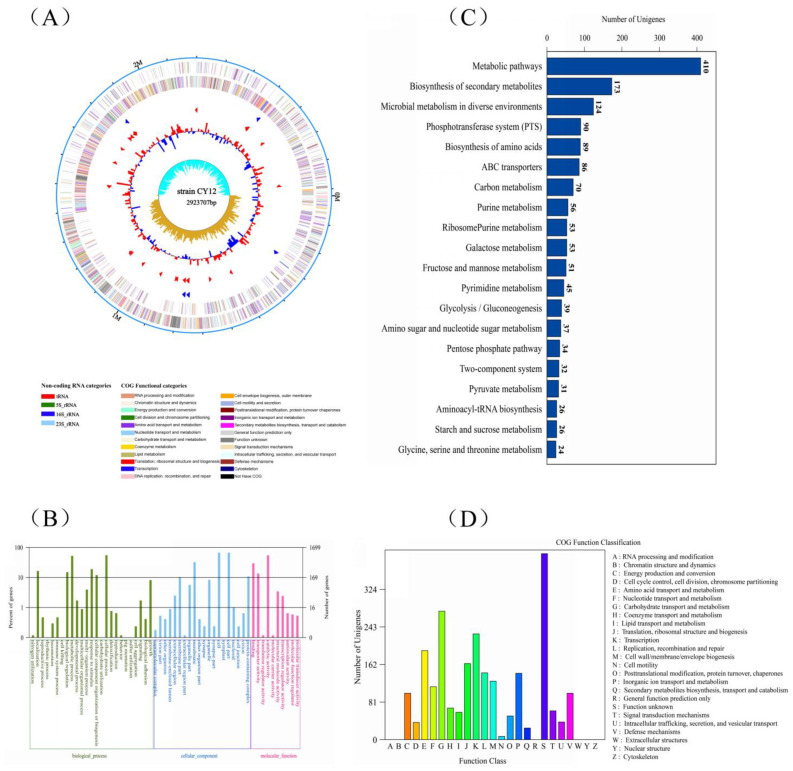
Figure 3.
Whole-genome sequencing of selected strains. (A) The complete circular genome map of strain CY12; the outermost circle of the circle diagram is the marker of genome size, and each scale is 0.5 MB; the second and third circles are CDS on the positive and negative chains. Different colors indicate the functional classification of different COG of CDS. The fourth circle is rRNA and tRNA; the fifth circle is GC content. The outward red part indicates that GC content in this region is higher than the average GC content in the whole genome. The higher the peak value, the greater the difference between GC content in this region and the average GC content. The innermost circle is the GC skew value, and the specific algorithm is G-C/G + C. In the biological sense, when the value is positive, the positive chain is more inclined to transcribe CDS; when the value is negative, the negative chain is more inclined to transcribe CDS (the form of the circle graph is flexible, and the above is only the most traditional form); (B) gene ontology (GO) analysis of strain CY12 genome; (C) KEGG pathways enrichment for strain CY12 genome; (D) the Clusters of Orthologous Groups of proteins (COG) functional classification of the CY12 strain genome.

