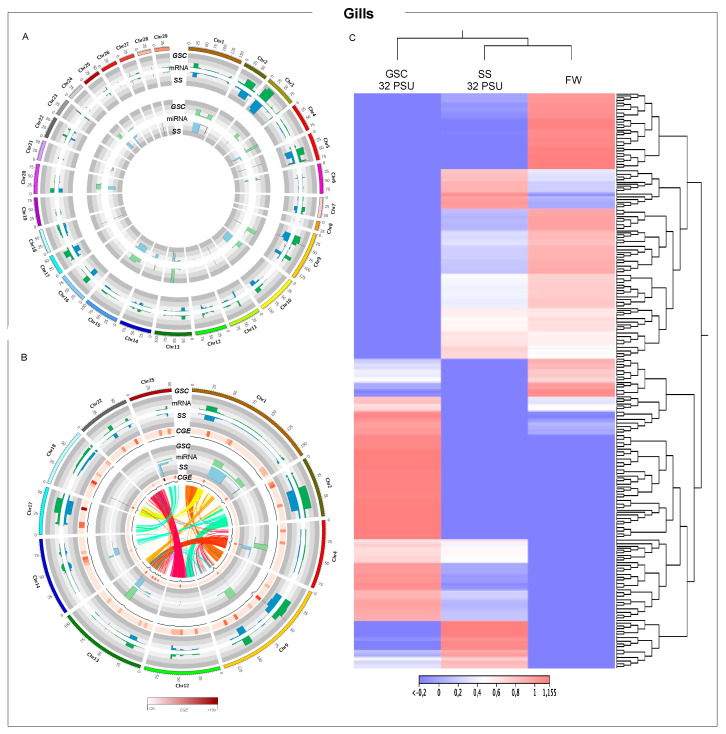
Figure 2.
Whole-genome transcription of Atlantic salmon gills during smoltification process. (A) Threshold analysis of gills for GSC and SS fish groups. (B) Chromosome regions with high CGE index variation between GSC and SS fish groups. Heatmap in red shows the expression variation between both groups, CGE index. Black line graph indicates genome coverage of threshold areas. In the Circos plot, the ribbons represent the homoeologous regions in salmon genome. (C) RNA-Seq analysis of chromosome regions with high CGE index between experimental groups.

