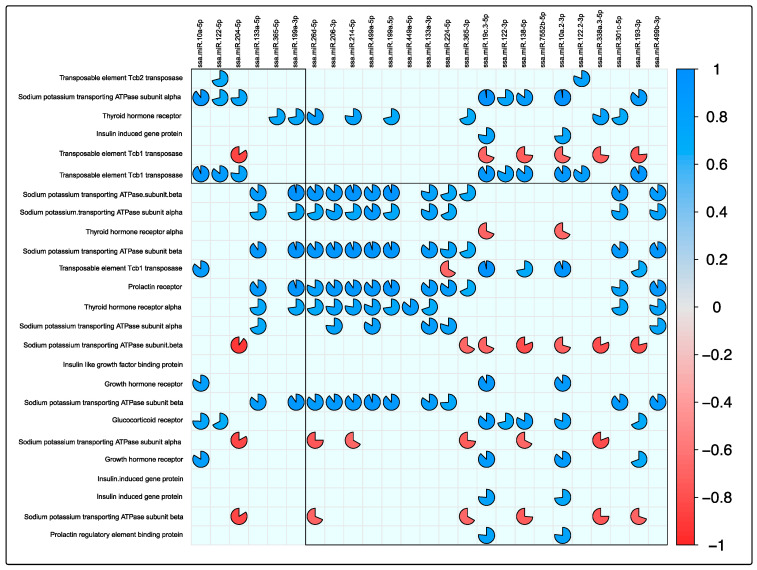
Figure 8.
Correlation analysis of expression pairs among smoltification-related genes, TEs, and differential expressed miRNAs. TPM values. Corrplot analyses were conducted on differentially expressed smoltification-related genes, TEs, and differential expressed miRNAs (fold change > |4| and p-value < 0.01) in the combination of all the data, including exposure to the three tissue and GSC and SS conditions. Only Pearson’s correlation values that were significant (p-value > 0.01) are shown in the plot. Red pies correspond to significant negative correlations, and blue pies correspond to significant positive correlations. The completeness of the pies corresponds to the correlation level, where pies closer to circular shape correspond to values more proximal to |1| in Pearson’s calculation.

