Table A2.
Explanation of different methods for estimating the relationship between animal AMU and human AMR at the population level.
| Method | Description | Data Requirement | Reference Examples for the Case of AMU and AMR |
|---|---|---|---|
| Transmission dynamic mathematical models | Can take a number of forms; including individual-based models, difference equation models, and differential equation models. These simulation models attempt to track important OH sub-populations, their resistance carriage and antibiotic exposure, with transmission rates dependent on current prevalence (dynamic) | Inputs: antibiotic exposure, population sizes, infection rates To fit to: prevalence of AMR (colonising or infecting) over time for each sub-population. This can be used to infer transmission parameters and selection rates (per antimicrobial) exposure) |
(Booton et al., 2021) [21] A single equation from this model of Thailand where t is time; H, A, and E are resistance prevalence in different sub-populations; xy is the transmission of resistance between sub-populations x and y; ΛH is human AMU; γ is the speed at which humans and animals are colonised by resistant bacteria; and μH is the natural rate of decay of resistance in humans |
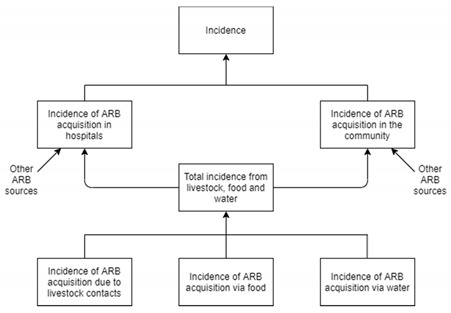
| Decision-analytic hierarchical models | The prevalence of AMR in infections in humans is a specified function of a range of factors across the various OH compartments, which in turn are functions of other factors | Actual or approximate values for all of the parameters used across the three OH compartments: human (e.g., incidence of raw meat consumption), animal (e.g., prevalence of biosecurity measures in farms), and environment (e.g., prevalence of good manufacturing practices). AMR surveillance data for external validation |

|
| (Opatowski et al., 2020) [61] The risk of human AMR acquisition in a representative Asian population is modelled using this multi-level causal model | |||
| Panel regression models | Data on AMR and AMU in humans and food-producing animals, as well as other relevant covariates, are collected over time and for multiple geographical units (e.g., countries or administrative areas). Human AMR is regressed against these covariates using a method such as fixed effects (static) or system GMM (dynamic) | Country-level surveillance data on AMR and AMU in humans and food-producing animals over time, as well as country-level data on appropriate controls, e.g., medical staffing, portion of employment in agriculture, population density, average annual temperature, and income per capita |
(Zhang, Cui and Zhang, 2018) [56] Where lnAMR is log AMR prevalence in humans, i denotes country and t denotes year; MS denotes the number of medical staff and VP denotes the number of veterinary professionals; and VAMC and HAMC denote veterinary and human antimicrobial consumption Fluoroquinolone resistance in E. coli and P. aeruginosa is regressed against a series of country-level factors for a panel of European countries |
