Figure 4.
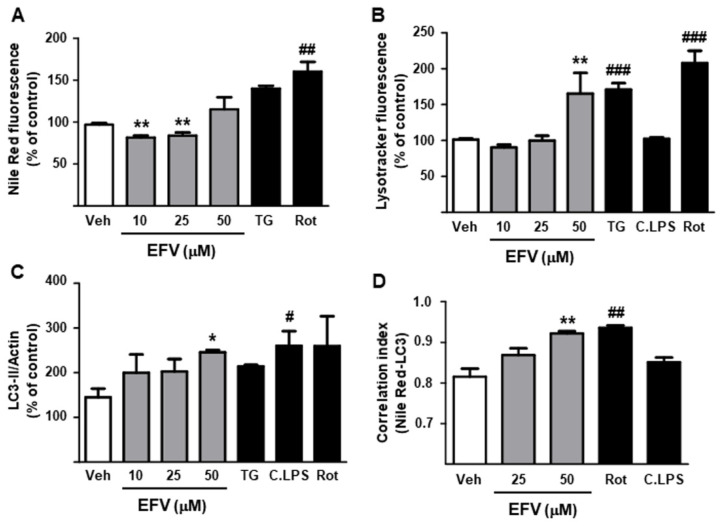
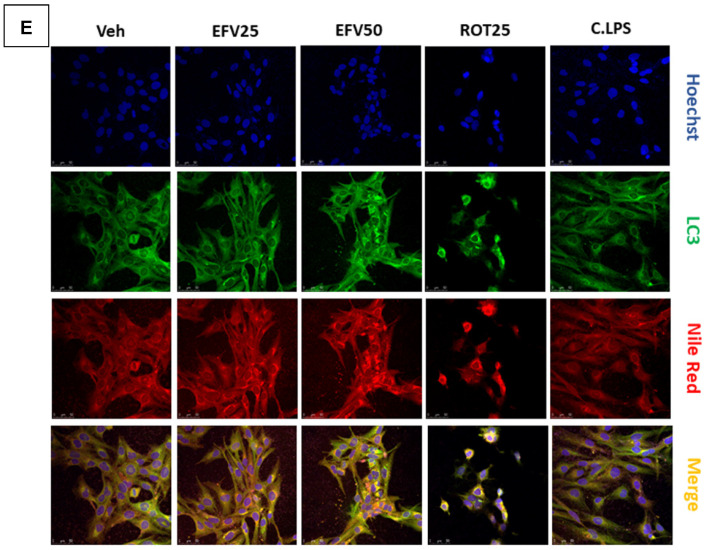
EFV-induced reduction in lipid droplets in LX2 cells is associated with activation of autophagy. (A) Intracellular content of lipid droplets evaluated by Nile Red fluorescence (n = 6). (B,C) Analysis of autophagy markers: lysosome signal (Lysotracker fluorescence) and protein expression of LC3-II (n = 5–6). (D) Correlation index between Nile Red and LC3 fluorescences (n = 5) (E) Representative images obtained from confocal microscopy experiments showing Hoechst 33342, LC3, Nile Red and merge (n = 5). All the data (represented as mean ± SEM) were calculated as a percentage of control (untreated cells) and analyzed by a one-way ANOVA multiple comparison test followed by a Newman–Keuls test (* p < 0.05, ** p < 0.01 versus the respective vehicle). Thapsigargin (TG), rotenone (Rot) and cocktail of LPS (C.LPS) were independently analyzed by a Student’s t-test (# p < 0.05, ## p < 0.01, ### p < 0.001).


