Figure 6.
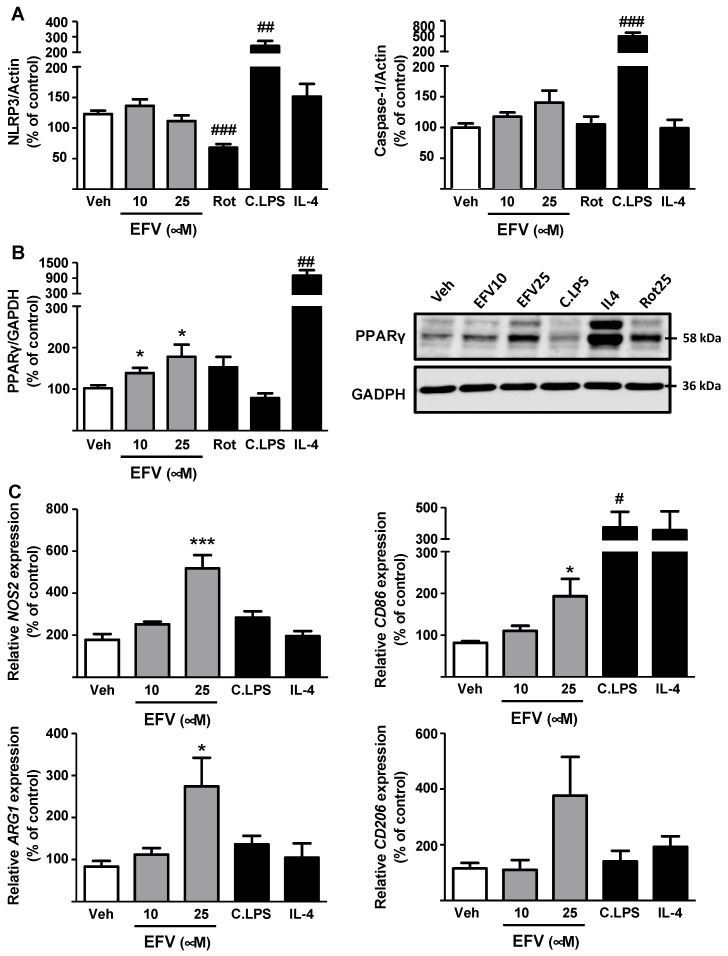
Efavirenz induces anti-inflammatory pathways in macrophages. (A) Determination of protein expression of NLRP3 and Caspase-1 (n = 8–10). (B) Representative Western Blot image of PPARγ and summary of densitometry data obtained from independent experiments after 24 h treatment (n = 5). (C) Analysis of relative mRNA expression levels of M1 (NOS2 and CD86) and M2 markers (ARG1 and CD206) by RT-PCR. Data were normalized versus the housekeeping gene β-actin (n = 5–6). Data were represented as mean ± SEM, were calculated as a percentage of control (untreated cells) and analyzed by a one-way ANOVA multiple comparison test followed by a Newman–Keuls test (* p < 0.05, *** p < 0.001 versus the respective solvent). Positive controls employed (rotenone -Rot-, cocktail of LPS -C.LPS- and interleukin 4 -IL-4-,) were independently analyzed by a Student’s t-test (# p < 0.05, ## p < 0.01, ### p < 0.001).

