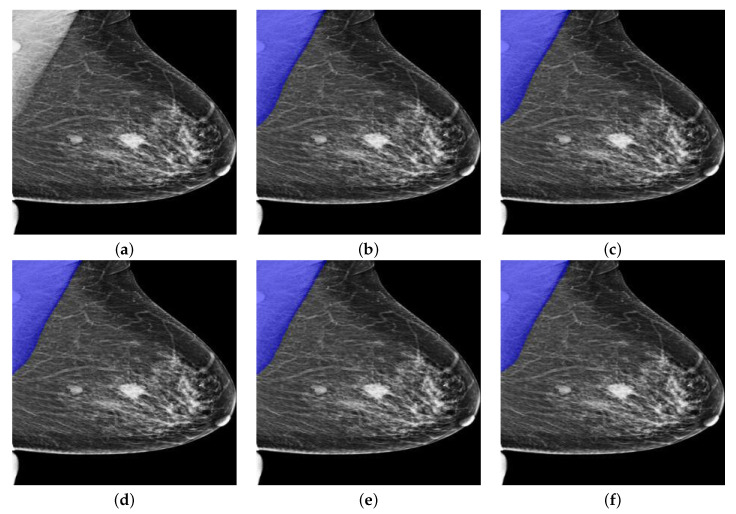
Figure 12.
A segmentation example from OPTIMAM by PeMNet with different backbones. (a) Pre-processed image. (b) : 99.00% of IoU, 99.70% of GPA, 98.41% of DSC, 96.87% of Jaccard, 99.53% of Sensitivity, and 99.88% of Specificity. (c) : 99.53% of IoU, 99.92% of GPA, 99.03% of DSC, 98.08% of Jaccard, 99.90% of Sensitivity, and 99.93% of Specificity. (d) : 99.57% of IoU, 99.78% of GPA, 99.20% of DSC, 98.41% of Jaccard, 99.59% of Sensitivity, and 99.97% of Specificity. (e) : 99.43% of IoU, 99.72% of GPA, 99.00% of DSC, 98.01% of Jaccard, 99.49% of Sensitivity, and 99.95% of Specificity. (f) : 99.49% of IoU, 99.76% of GPA, 99.03% of DSC, 98.08% of Jaccard, 99.56% of Sensitivity, and 99.95% of Specificity.

