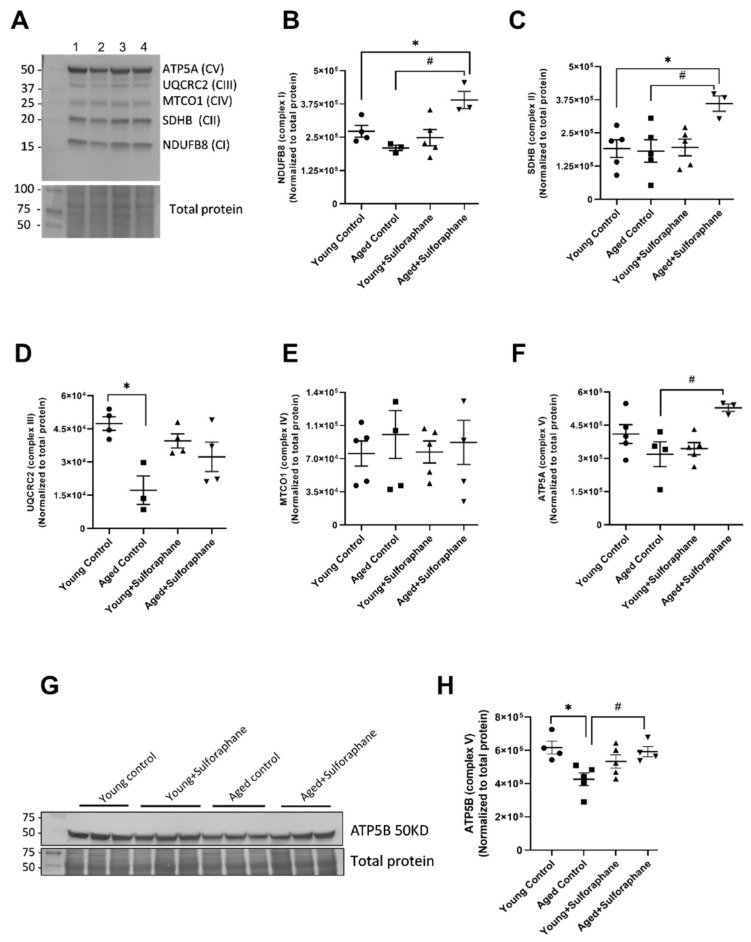
Figure 3.
Effect of sulforaphane on the protein expression of ETC complex subunits of mitochondria in the kidney cortex. (A) Representative protein blot of complex I to complex V subunits. Lane 1: young control, lane 2: aged control, lane 3: young+sulforaphane, lane 4: aged+sulforaphane. Bar graphs representing protein expression of (B) complex I (NDUFB8) subunit, (C) complex II (SDHB8) subunit, (D) complex III (UQCRC2) subunit, (E) complex IV (MTCO1), and (F) complex V (ATP5A) subunit. (G,H) Western blot image of ATP5B and bar graph representing protein expression of ATP5B (complex V subunit) in young control (young F344 rats kept on tap water); aged control (aged F344 rats kept on tap water); young+sulforaphane (sulforaphane (15 mg/kg body wt/day) in drinking water); aged+sulforaphane. Band intensities presented as mean ± SEM, n = 3–5 rats. Data normalized to total protein. * p < 0.05 significantly different from young control rats; # p < 0.05 significantly different from aged control rats, using 1-way ANOVA followed by Newman–Keuls post-hoc test.

