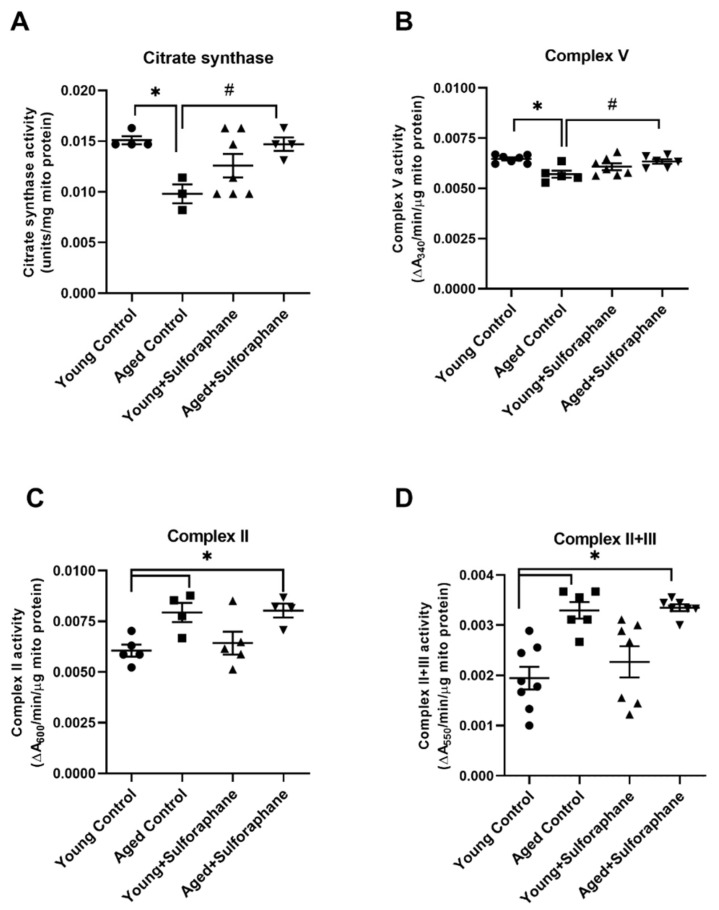
Figure 4.
Effect of sulforaphane on mitochondrial enzyme activities. Bar graph representing enzyme activities of (A) citrate synthase, (B) complex V, (C) complex II, and (D) complex II+III in young control (young F344 rats kept on tap water); aged control (aged F344 rats kept on tap water); young+sulforaphane (sulforaphane (15 mg/kg body wt/day) in drinking water); aged+sulforaphane. Results are presented as mean ± SEM, n = 3–7 rats. * p < 0.05 significantly different from young control rats; # p < 0.05 significantly different from aged control rats, using 1-way ANOVA followed by Newman–Keuls post-hoc test.

