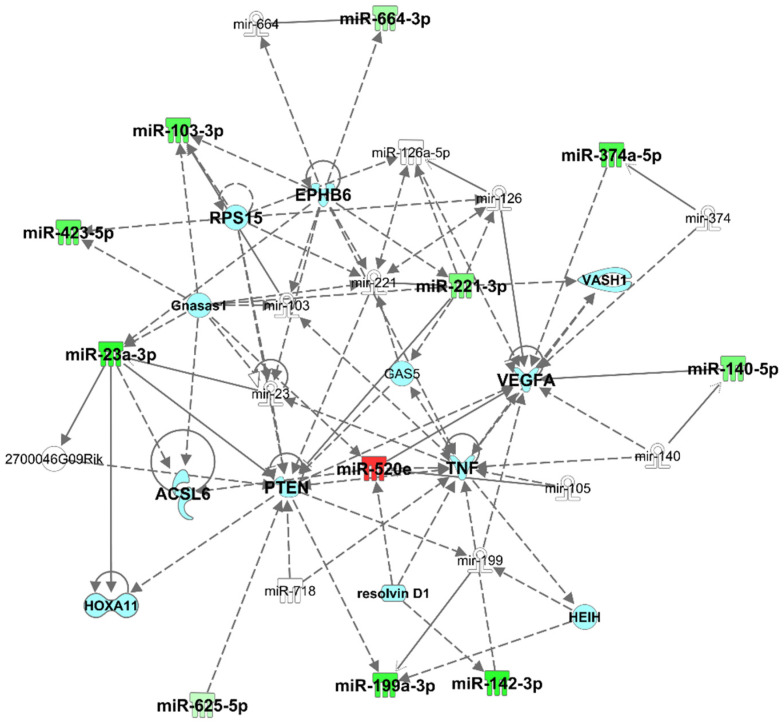
Figure 1.
Top network identified by Ingenuity Pathway Analysis (IPA) for chronic mild traumatic brain injury (mTBI) versus control: Connective Tissue Disorders, Inflammatory Disease, and Organismal Injury and Abnormalities. Green indicates genes that are downregulated, and red indicates genes that are upregulated, where increased color saturation represents more extreme down- or upregulated in the dataset. Solid lines represent direct interactions, nontargeting interactions, or correlations between chemicals, proteins, or RNA. Dotted lines represented indirect interaction. Arrowed lines represent activation, causation, expression, localization, membership, modification, molecular cleavage, phosphorylation, protein–DNA interactions, protein–TNA interaction, binding regulation, and transcription. Shapes represent molecule type (double circle = complex/group; square = cytokine; diamond = enzyme; inverted triangle = kinase; triangle = phosphatase; oval = transcription regulator; trapezoid = transporter; circle = other). Reprinted from Ingenuity Pathway Analysis under a CC BY 4.0 license, with permission from QIAGEN Silicon Valley, original copyright 2000–2021.

