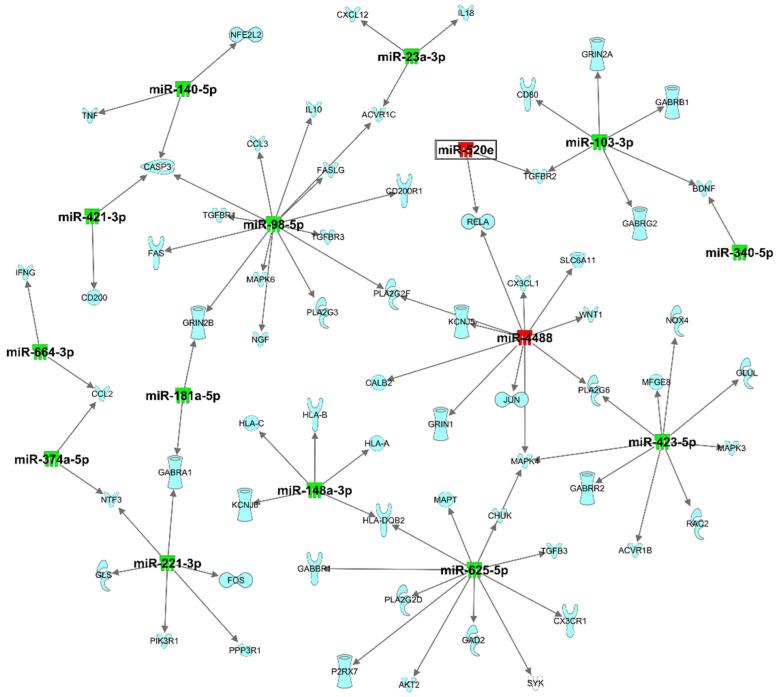
Figure 2.
Target filter analysis of dysregulated exomiRNA targeting mRNA associated with neuroinflammation pathways. Green indicates genes that are downregulated, and red indicates genes that are upregulated, where increased color saturation represents more extreme down- or upregulated in the dataset. Reprinted from Ingenuity Pathway Analysis under a CC BY 4.0 license, with permission from QIAGEN Silicon Valley, original copyright 2000–2021.

