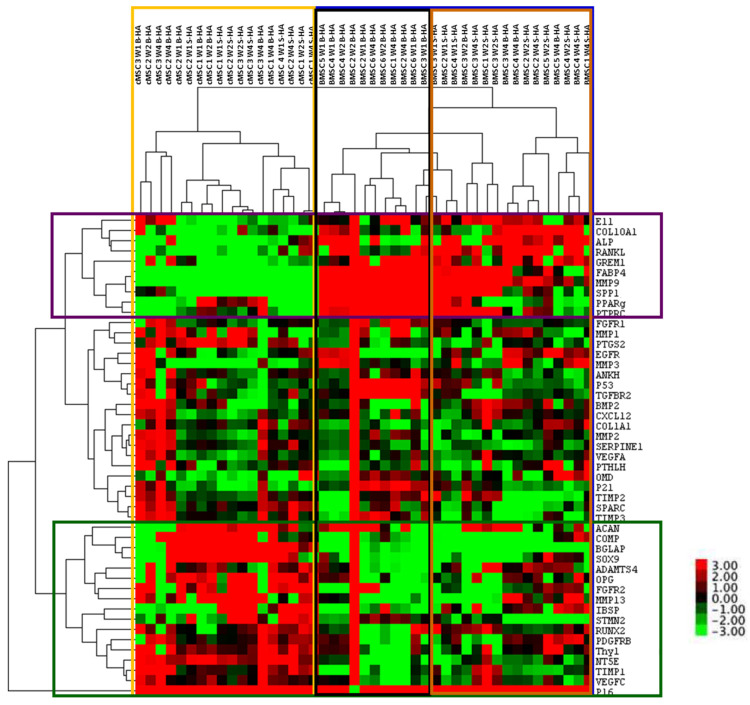
Figure 4.
Cluster analysis of all samples and all genes. Cluster analysis of cMSCs and BMSCs after lysis from B-HA and S-HA scaffolds. Labels on the right indicate the genes, and labels on the top indicate samples. The range of gene expression levels varies from the highest expression in red to the lowest in green. Their colour key for the relative expression is on the right. Data are presented for n = 3 cMSCs and n = 6 BMSCs, coloured boxes are explained in the text.

