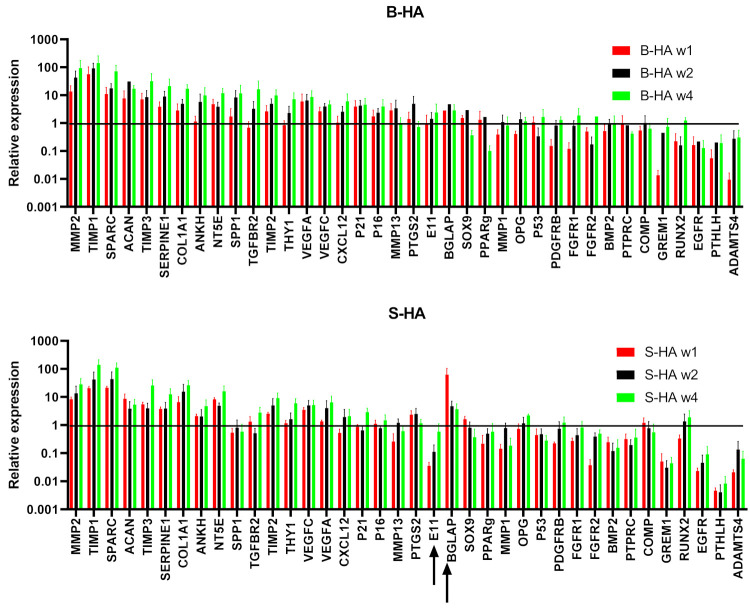
Figure 5.
Gene expression of cMSCs normalised to HPRT. Top panel shows the gene expression of transcripts on B-HA, and the bottom panel shows gene expression of transcripts on S-HA for week 1, 2 and 4. Data were normalised to the housekeeping gene HPRT1, indicated with the black horizontal line. Black arrows indicate genes that displayed expression levels lower than that of the housekeeping gene. Data are shown as mean with standard error of mean for n = 3 cMSCs.

