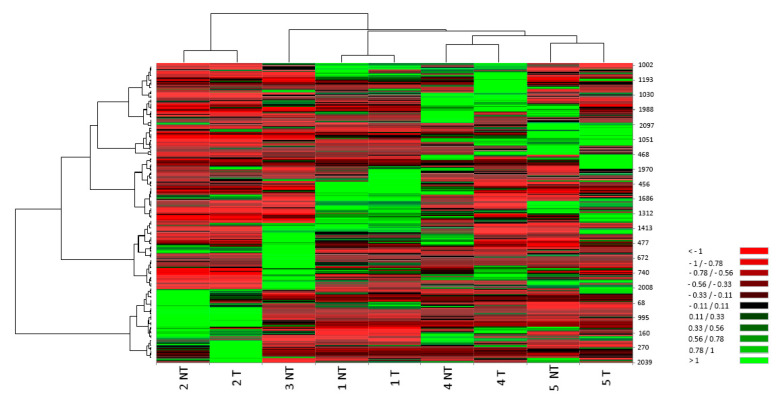
Figure 4.
Heat maps: columns correspond to individual preparations of cryopreserved sperm that are untreated (NT) or treated with 20 mg/mL myo-inositol for 20 min after cryopreservation (Post-T), while rows correspond to matched spots. Colour scale (from high value in green to low value in red) illustrates % volume values of the spots.

