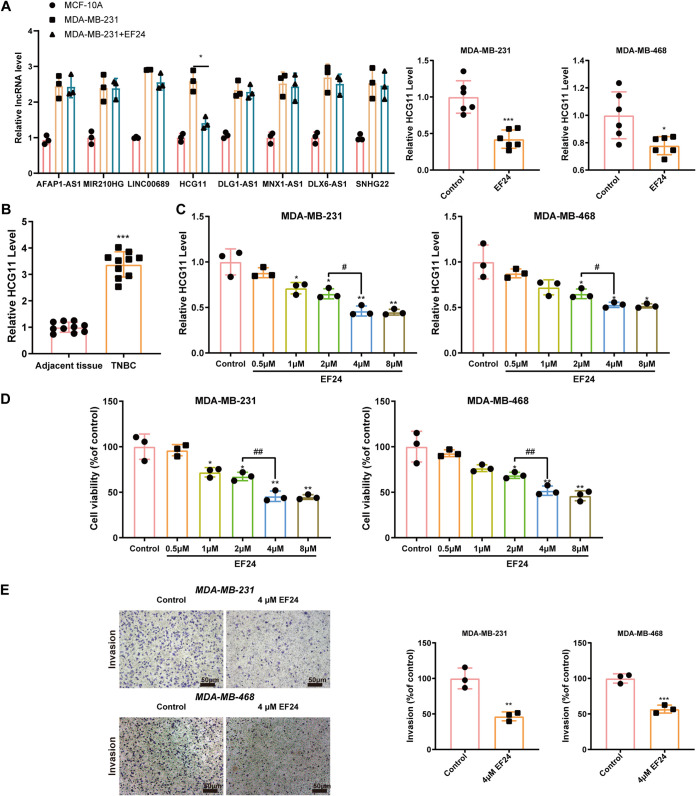
FIG 2.
EF24 downregulated HCG11 expression, reduced cell viability, and suppressed cell invasion in TNBC cells in vitro. (A) Left: qRT-PCR analysis of candidate lncRNA expressions in MCD-10A, MDA-MB-231, and MDA-MB-231+EF24 (4 μm) cells (*, P < 0.05). Right: qRT-PCR analysis of HCG11 expression in xenograft tumors of mice from MDA-MB-231+control, MDA-MB-231+EF24, MDA-MB-468+control, and MDA-MB-468+EF24 groups (n = 6 for each group). (B) qRT-PCR analysis of HCG11 expression in the cancerous tissues and adjacent tissues of TNBC patients (n = 10). (C and D) MDA-MB-231 and MDA-MB-468 cells were incubated with EF24 (0, 0.5, 1, 2, 4, or 8 μm) for 48 h. (C) qRT-PCR analysis of HCG11 expression. (D) Methyl thiazolyl tetrazolium (MTT) assay of cell viability. (E) Transwell assay of cell invasion in MDA-MB-231 and MDA-MB-468 cells incubated with EF24 (0 or 4 μm) for 48 h (scale bars = 50 μm). Shapiro-Wilk test was used to check whether the data follow a normal distribution and F-test was used to verify if the variances were significantly different. F-test P < 0.05: a heteroskedasticity t test (two groups) and Brown-Forsythe and Welch ANOVA test (more than two groups). F-test P ≥ 0.05: a homoscedastic t test (two groups) and ordinary ANOVA test (more than two groups). *, P < 0.05; **, P < 0.01; ***, P < 0.001 versus adjacent tissues or control (MDA-MB-231/MDA-MB-468 cells treated with 0 μm EF24); #, P < 0.05; ##, P < 0.01.

