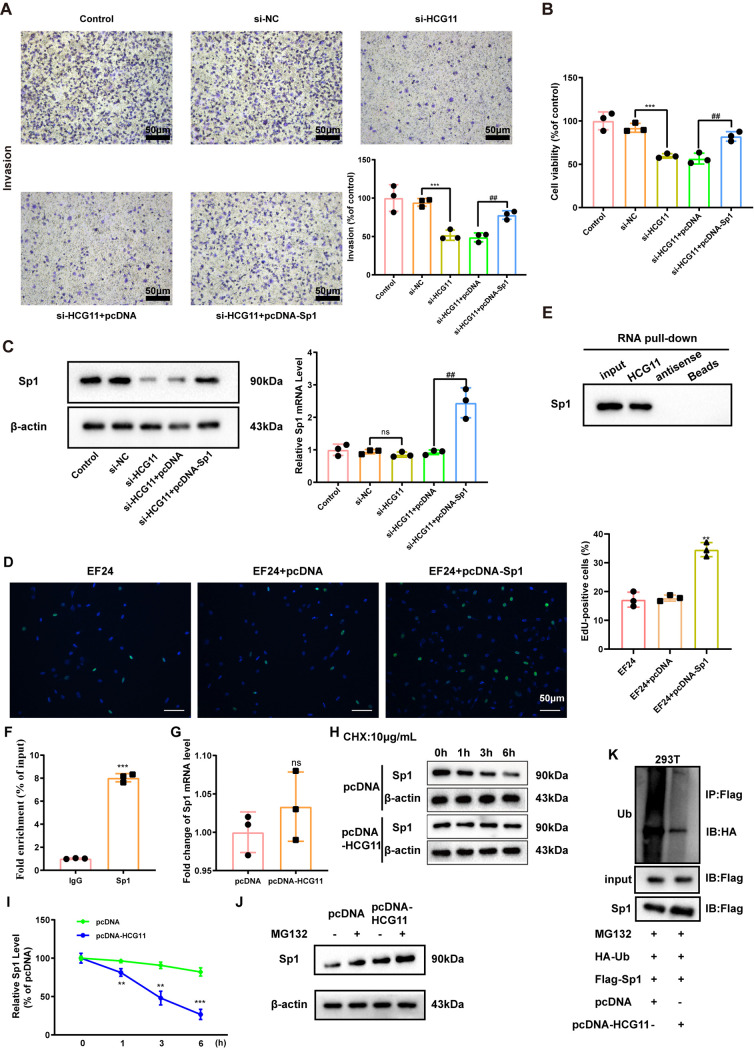
FIG 4.
HCG11 modulate viability and invasion of TNBC cells by targeting Sp1 transcription factor (Sp1). (A to C) MDA-MB-231 cells were transfected with si-NC, si-HCG11, si-HCG11+pcDNA-Sp1, and si-HCG11+the negative control of pcDNA-Sp1 (pcDNA). (A) Cell invasion was measured using Transwell assay (scale bars = 50 μm). (B) Cell viability was measured using an MTT assay. (C) The protein and mRNA levels of Sp1 were measured using Western blot and qRT-PCR, respectively. β-Actin was served as the internal control. (D) Cell proliferation was measured by EdU staining in MDA-MB-231 cells treated with EF24, EF24+pcDNA, or EF24+pcDNA-Sp1. (E) Western blot analysis of Sp1 level in the complexes pulled down by biotinylated HCG11/antisense probe in MDA-MB-231 cells. (F) qRT-PCR analysis of HCG11 level in the immunoprecipitates of anti-Sp1/IgG antibody in MDA-MB-231 cells. (G) qRT-PCR analysis of Sp1 level in MDA-MB-231 cells transfected with pcDNA or pcDNA-HCG11. (H and I) MDA-MB-231 cells were transfected with pcDNA or pcDNA-HCG11, followed by incubating with 10 μg/ml cyclohexane (CHX) for 0, 1, 3, and 6 h. Representative bands were shown in panel H, and quantitative results were shown in panel I. (J) Western blot analysis of Sp1 in MDA-MB-231 cells treated with pcDNA, pcDNA+MG132 (10 μM, 2 h), pcDNA-HCG11, and pcDNA-HCG11+ MG132 (10 μM, 2 h). (K) Coimmunoprecipitation (Co-IP) analysis was performed to evaluate the combination between HA-ubiquitin (Ub) and Flag-Sp1 in 293T cells treated with MG132+HA-Ub+Flag-Sp1+pcDNA/pcDNA-HCG11. Shapiro-Wilk test was used to check whether the data follow a normal distribution and F-test was used to verify if the variances were significantly different. F-test P < 0.05: a heteroskedasticity t test (two groups) and Brown-Forsythe and Welch ANOVA test (more than two groups). F-test P ≥ 0.05: a homoscedastic t test (two groups) and ordinary ANOVA test (more than two groups). (A, B, C) ***, P < 0.001; ##, P < 0.01; ns, no significance; (D) **, P < 0.01 versus EF24+pcDNA; (F) ***, P < 0.001 versus IgG; (G) ns, no significance; and (I) **, P < 0.01; ***, P < 0.001 versus pcDNA.

