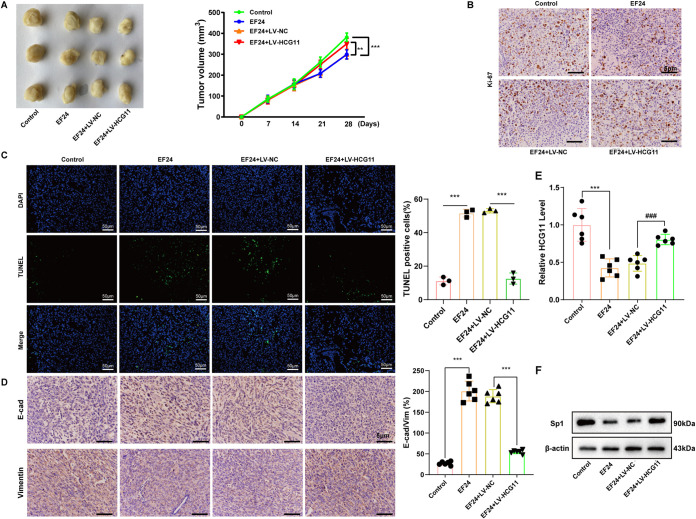
FIG 6.
HCG11 overexpression eliminated the antitumor effect of EF24 on TNBC in vivo. BALBC/c nude mice were divided into control, EF24, EF24+LV-HCG11, and EF24+the negative control of LV-HCG11 (LV-NC) groups (n = 6 for each group). On day 0, 1 × 10⁶ control/LV-HCG11-infected/LV-NC-infected MDA-MB-231 cells were subcutaneously injected into mice. On days 14 to 28, mice in EF24, EF24+LV-NC, and EF24+LV-HCG11 groups were treated with EF24 (3 mg/kg/d) and mice in the control group were treated with the same volume of vehicle. (A) Left: representative images of xenograft tumor in each group on day 28. Right: the xenograft tumor volumes were calculated at days 0, 7, 14, 21, and 28 in each group. (B) Representative images of immunohistochemical staining for Ki-67 performed on xenograft tumors (scale bar = 5 μm). (C) Representative images of TUNEL assay performed on xenograft tumors (scale bars = 50 μm). (D) Representative images of immunohistochemical staining for E-cadherin and vimentin performed on xenograft tumors (scale bars = 5 μm). (E) qRT-PCR analysis of HCG11 expression in xenograft tumors. (F) Western blot analysis of Sp1 protein level performed in xenograft tumors. Shapiro-Wilk test was used to check whether the data follow a normal distribution and F-test was used to verify if the variances were significantly different. F-test P < 0.05: Brown-Forsythe and Welch ANOVA test. F-test P ≥ 0.05: ordinary ANOVA test.**, P < 0.01; ***, P < 0.001; ###, P < 0.001.

