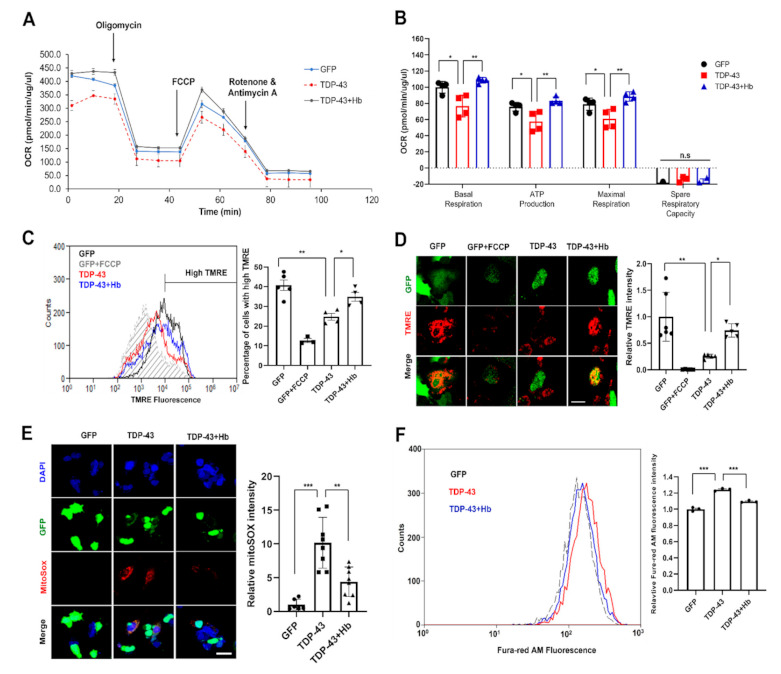
Figure 5.

Hydroxocobalamin attenuates TDP-43-induced mitochondrial dysfunction. SH-SY5Y cells were infected with the GFP- or GFP-tagged human WT TDP-43 lentivirus and grown for 2 days. The day before harvest, cells were treated with Hb (10 µM) for 24 h. (A) Mitochondrial function was analyzed by detecting basal respiration, ATP production, maximal reserve and respiratory capacity with a Seahorse XF analyzer. The OCR was normalized to the total protein concentration. (B) Quantification of basal respiration, ATP production, maximal reserve and respiratory capacity as a percentage of basal values. Error bars represent the mean values ± SD of three independent experiments. * p < 0.05, ** p < 0.01, and n.s., not significant (one-way ANOVA with Tukey’s multiple comparison test). (C) Representative traces of TMRE fluorescence measured using flow cytometry (n = 3, at least 10,000 live cells were analyzed per independent replicate). The mean fluorescence intensity of GFP-tagged cells treated with the decoupling agent FCCP is indicated by the gray dotted line. The average fluorescence intensity of the high TMRE region was measured and reported as a percentage. Data are presented as the means ± SD of three independent experiments. Statistical analyses were performed using one-way ANOVA followed by Tukey’s multiple comparison test. * p < 0.05 and ** p < 0.01. (D) Confocal images of SH-SY5Y cells stained with TMRE. All images were collected from the Z-stack and projected as a single image. Cells were stained with TMRE (red) and GFP (green) before imaging. The ratio of TMRE-positive cells in the control or GFP-tagged human WT TDP-43-expressing cells was quantified. Quantification was performed using ImageJ software. Error bars represent the mean values ± SD of three independent experiments. The significance of differences was determined using one-way ANOVA with Bonferroni’s multiple comparison test (* p < 0.05 and *** p < 0.001). Scale bars, 20 μm. (E) Confocal images of SH-SY5Y cells stained with mitoSOX-red after infection with the GFP- or GFP-tagged human WT TDP-43 lentivirus and DAPI (blue) staining. Cells expressing GFP-tagged human WT TDP-43 showed significantly increased mitoSOX signals compared with the control. MitoSOX signals were restored in TDP-43-expressing cells treated with Hb. Quantification was performed using ImageJ software. Data from three independent experiments were analyzed using one-way ANOVA followed by Bonferroni’s multiple comparison test (** p < 0.01 and *** p < 0.001). Scale bars, 25 μm. (F) SH-SY5Y cells overexpressed GFP- or GFP-tagged human WT TDP-43, and the cells were loaded with the Ca2+ indicator Fura-red/AM and detected using flow cytometry. Data are presented as the means ± SD of three independent experiments. *** p < 0.001 (one-way ANOVA followed by Tukey’s multiple comparison test).
