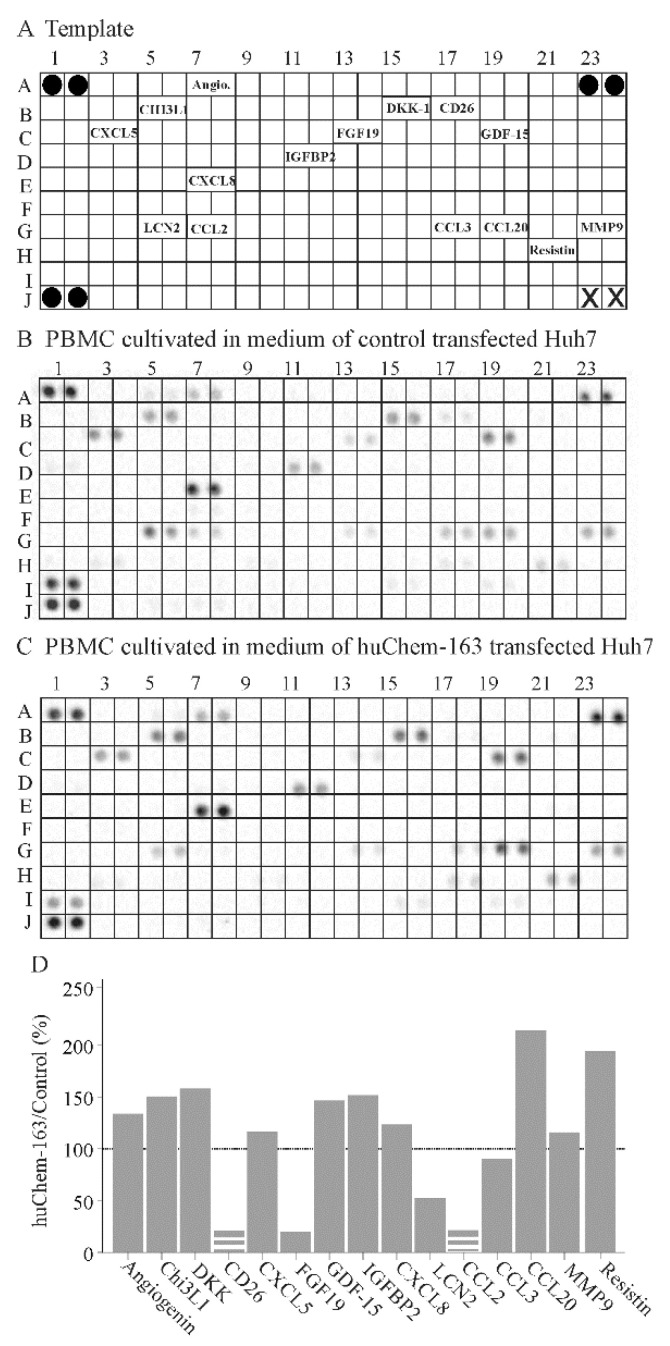
Figure 8.
Cytokine array of peripheral blood mononuclear cells (PBMC)s exposed to supernatant of huChem-163 expressing or control-transfected Huh7 cells: (A) Template of the array. The soluble factors detected are given at the respective position of the array. Black circles represent the reference spots and X the positions where no antibody was spotted. (B) Array hybridized with media of PBMCs cultivated in supernatant of control-transfected Huh7 cells. (C) Array hybridized with media of PBMCs cultivated in supernatant of huChem-163 expressing Huh7 cells. (D) Arrays were quantified with ImageJ, and the ratios of huChem-163/control stimulated cells are shown. The broken bars were used when the respective cytokine was not detectable on the array shown in (C) and the extent of downregulation could not be calculated. The dotted line marks 100%. n = 1. Angiogenin = Angio.

