Figure 8.
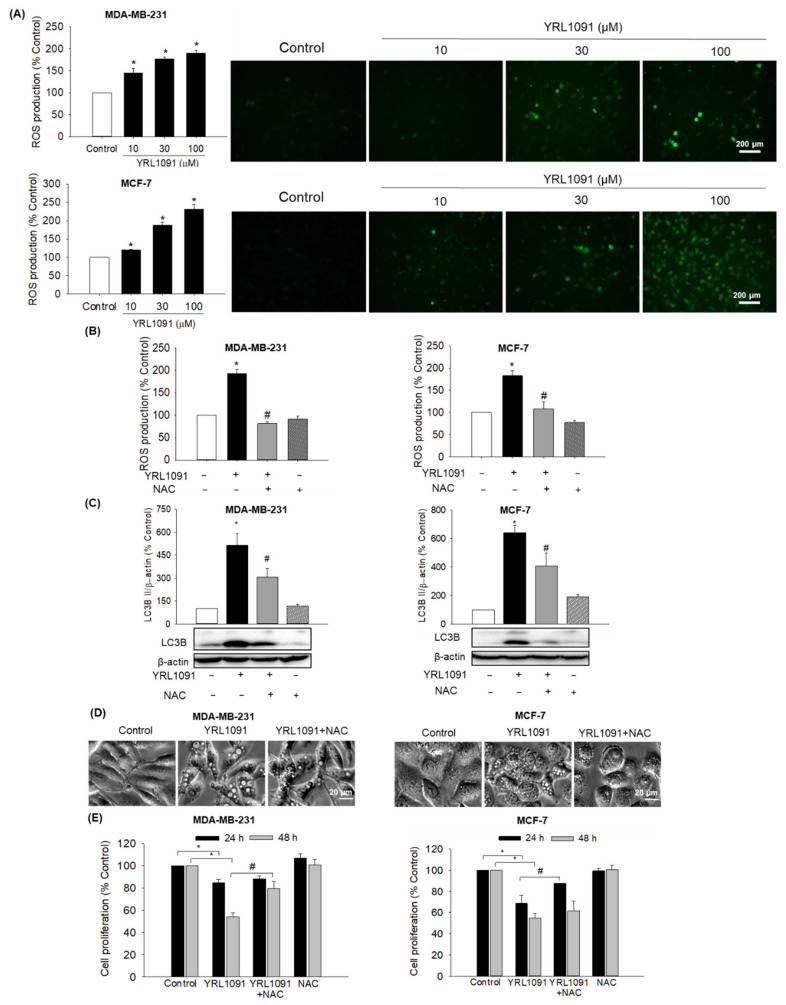
Involvement of YRL1091-induced ROS production in cytoplasmic vacuolization and cell death in MDA-MB-231 and MCF-7 cells. (A) Cells were challenged with YRL1091 at 10, 30, and 100 µM for 12 h. Intracellular ROS levels were quantified by DCFH-DA assay as described in Materials and Methods. Representative fluorescence microscopic images were shown. (B) Cells were pretreated with 10 mM NAC for 2 h, followed by exposure to 30 µM YRL1091 for 12 h. Intracellular ROS levels were caculated as the pecentages of those mesured in vehicle-treated control cells. (C) Cells were treated as described in (B) for 24 h and subjected to western blotting for LC3B. Each data point was calculated as the percentage of protein level in vehicle-treated control cells. Representative blots were presented. (D) Phase-contrast images were obtained after 12 h of treatment. Scale bar: 20 µm. (E) Cell viability was determined by SRB assay at 24 and 48 h. The cell viability of each treated group was expressed as the percentage of that in control group. Data are displayed as the mean ± SEM from at least three independent experiments. * p < 0.05 vs. vehicle-treated control cells; # p < 0.05 vs. YRL1091-treated cells.

