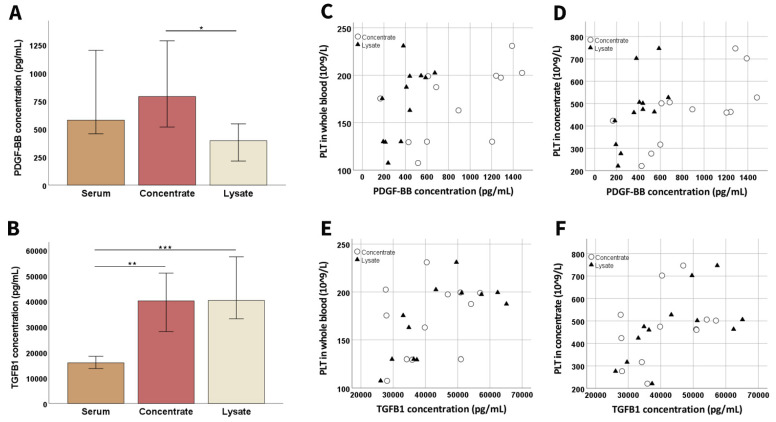
Figure 2.
Growth factor concentrations during blood processing. Median platelet-derived growth factor (PDGF-BB; (A)) and transforming growth factor-β1 (TGFB1; (B)) concentrations at the different stages of blood processing (whole blood, concentrate, and lysate before filtration; samples had been stored at −80 °C before analysis) are presented; error bars display the 95% confidence intervals. Friedman tests for group comparisons and subsequent post hoc tests were performed; the asterisks indicate the significant differences between the corresponding groups (* corresponds to p < 0.05; ** corresponds to p < 0.01; *** corresponds to p < 0.001). The dot plots show platelet (PLT) concentrations in whole blood (C,E) or concentrate (D,F) vs. PDGF-BB (C,D) or TGFB1 (E,F) concentrations in concentrate (circles) and lysate (triangles); the correlations shown in (C) (p < 0.01 and r = 0.729 for concentrate; p < 0.05 and r = 0.641 for lysate), (D) (p < 0.01 and r = 0.804 for concentrate; p < 0.01 and r = 0.748 for lysate), (E) (p < 0.05 and r = 0.676 for lysate), and (F) (p < 0.05 and r = 0.671 for lysate) were significant based on Spearman’s rank correlation. All data were obtained from n = 12 dogs.

