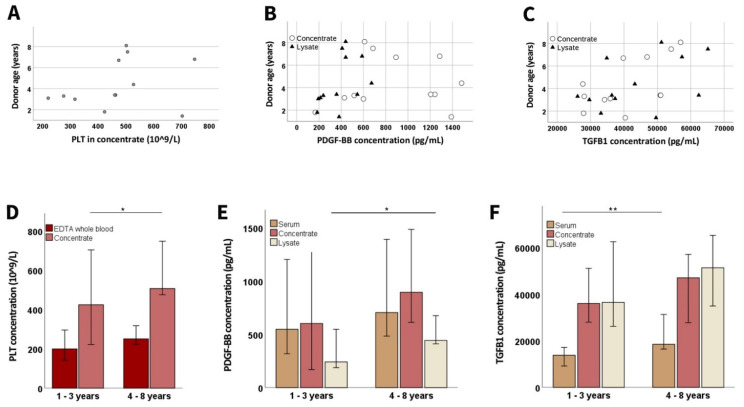
Figure 3.
Age-related differences in platelet and growth factor concentrations. The dot plots show donor age vs. platelet (PLT; (A)) concentration in concentrate, as well as platelet-derived growth factor (PDGF-BB; (B)) and transforming growth factor (TGFB1; (C)) concentrations in concentrate (circles) and lysate (triangles); the correlation shown in (B) was significant for lysate (p < 0.001 and r = 0.820, based on Spearman’s rank correlation). The bar plots show the median PLT (D), PDGF-BB (E), and TGFB1 (F) concentrations in EDTA whole blood or serum samples drawn directly from the donor dogs, as well as in samples from different processing stages, obtained from younger and older donors; data from the younger vs. the older animals were compared using Mann–Whitney U tests; the asterisks indicate the significant differences between the corresponding groups (* corresponds to p < 0.05; ** corresponds to p < 0.01). Data were obtained from n = 7 younger and n = 5 older dogs.

