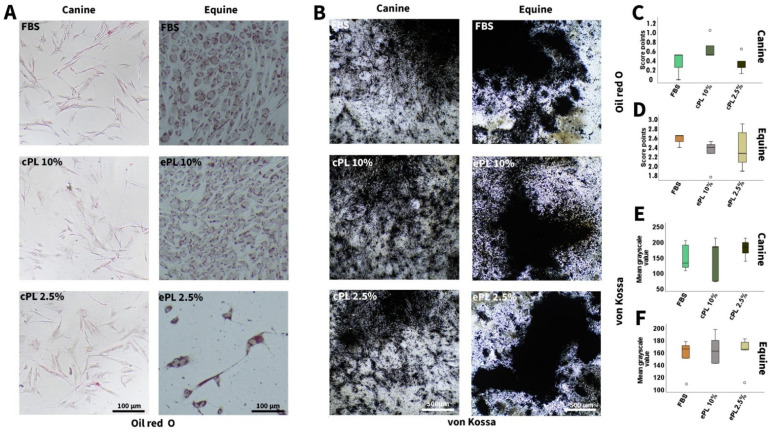
Figure 5.
Adipogenic and osteogenic differentiation. Representative bright-field photomicrographs show canine (left column) and equine (right column) mesenchymal stromal cells (MSC) after adipogenic (A) and osteogenic (B) differentiation, with Oil Red O and von Kossa staining, respectively. Boxplots display the corresponding data obtained by scoring adipogenic differentiation of canine (C) and equine (D) MSC and image analysis using Fiji ImageJ after osteogenic differentiation of canine (E) and equine (F) MSC. MSC were cultured in the media indicated before differentiation was induced (FBS: fetal bovine serum; cPL: canine platelet lysate; ePL: equine platelet lysate). Data were obtained using MSC from the same n = 5 donor dogs or horses in each group.

