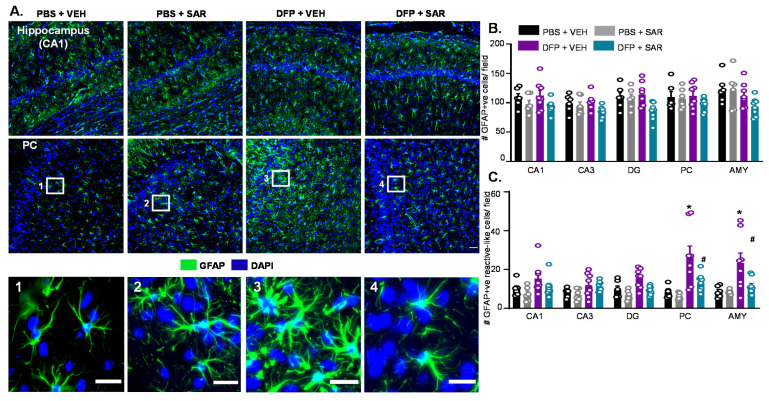
Figure 10.
Astrogliosis 10 weeks post-DFP (~20 min of SE) and mitigation by SAR. (A) Representative IHC images of GFAP positive cells from each treatment group. Scale, 50 μm for whole field (0.44 m2) images and 25 μm for boxed images (1–4). (B,C) Cell quantification. (B) Number of GFAP positive cells. (C) Number of GFAP positive cells with reactive-type morphology. Reactive cells were considered to have large cell bodies and retracted processes. All, n = 6–8, mixed measures ANOVA. * p < 0.05 compared to at least one control group # p < 0.05 compared to DFP + VEH (B-G).

