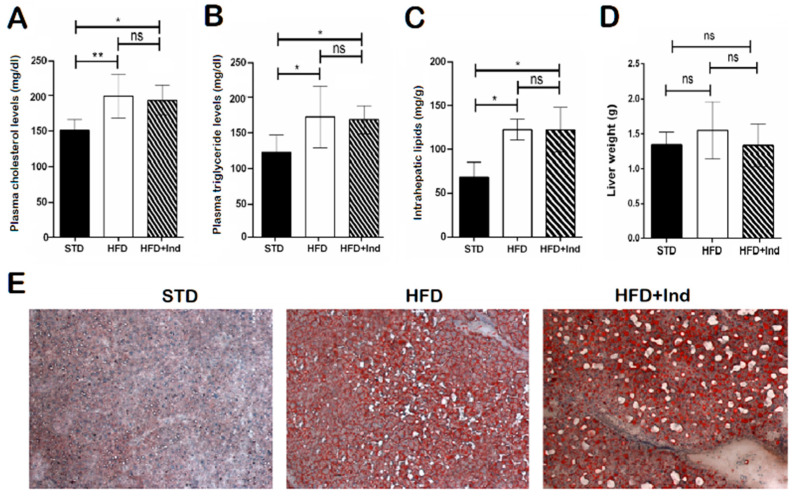
Figure 4.
Impact of indicaxanthin treatment on lipid disorders in HFD mice. Plasma cholesterol levels (A), plasma triglyceride levels (B), intrahepatic lipid levels (C), liver weight (D), Oil Red O staining of liver sections (E) in the different animal groups. Results are shown as means ± SEM of 8 animals/group. ns: p > 0.05; * p ≤ 0.05; ** p ≤ 0.01 (ANOVA associated with Bonferroni’s correction).

