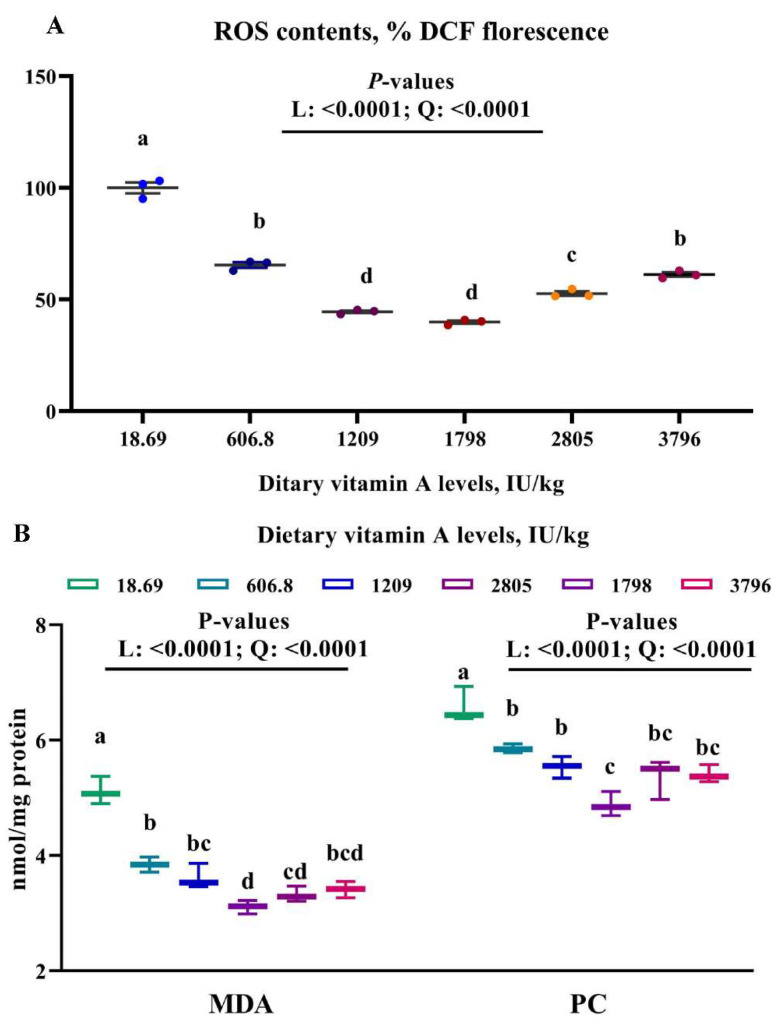
Figure 2.
Effects of dietary vitamin A on contents of ROS (A), MDA and PC (B) in muscle of on-growing grass carp. Data are means ± SEM of three replicate groups, two fish for each replicate (n = 3). a,b,c,d within a column, means without a common lowercase superscript differ (p < 0.05). p-values underlined with a solid line indicate a linear and quadratic response to dietary vitamin A levels. SEM = standard error of the mean; L = linear; Q = quadratic; ROS = reactive oxygen species, %DCF florescence; MDA = malondialdehyde, nmol/mg prot; PC = protein carbonyl, nmol/mg prot.

