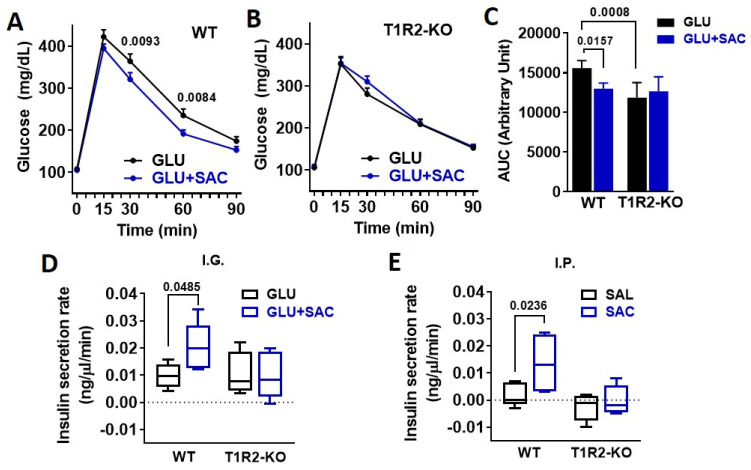
Figure 2.
Saccharin potentiates insulin secretion in vivo dependent on STR. (A,B) Glucose excursions in WT and T1R2-KO mice in response to an IGGTT (GLU, 694 mM; 1 g/kg) with or without saccharin (SAC, 0.1%) (n = 10 mice/group). Two-way ANOVA Sidak post hoc. (C) Area under curve (AUC) of glucose during the IGGTT was calculated as response X time. ANOVA Fisher’s LSD post hoc. (D) Insulin responses in WT and T1R2-KO mice in response to an IGGTT (GLU, 694 mM; 1 g/kg) with or without saccharin (SAC, 0.1%) (n = 5 mice/group). Two-way ANOVA Fisher’s LSD post hoc. (E) Insulin responses in WT and T1R2-KO mice during a single IP bolus of saline (SAL) or saccharin (SAC, 0.1%) (n = 5 mice/group). Two-way ANOVA Fisher’s LSD post hoc.

