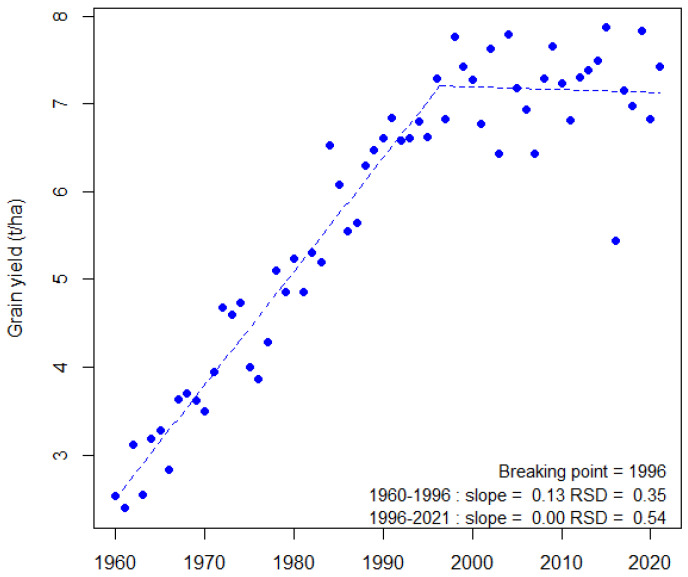
Figure 1.
Evolution of bread wheat grain yield from 1960 to 2021 in France. A bi-linear regression model was fitted (blue dotted line) for grain yield using the segmented R package [7] with default settings. The value of the breaking point and the values of slope and standard deviation of the residuals (RSD) are indicated for each period. Data were from the Agreste database (https://agreste.agriculture.gouv.fr/agreste-web/accueil/ (accessed on 31 October 2021)).

