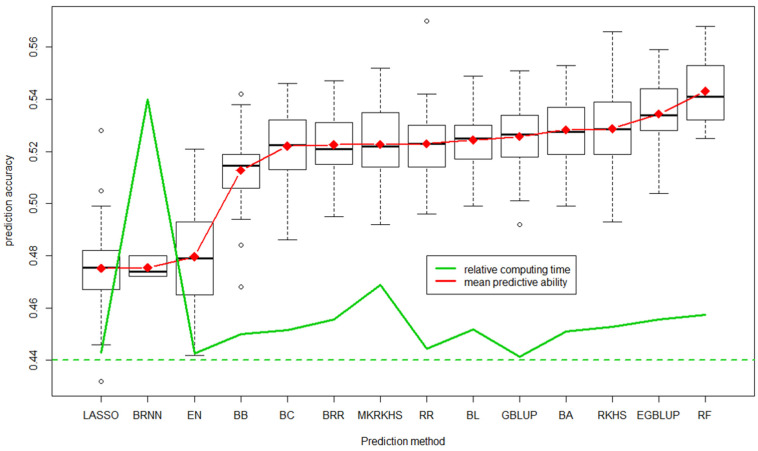
Figure 6.
Distribution of predictive ability of the 100 replicates for each of the 14 methods ordered based on average predictive accuracy [120]. Average is shown in red and relative computing time in green. LASSO: least absolute shrinkage and selection operator, BRNN: Bayesian regularization for feed-forward neural network, EN: elastic net, BB: Bayes B, BC: Bayes C, BRR: Bayesian ridge regression, MRKHS: multiple RKHS, RR: ridge regression, BL: Bayesian LASSO, GBLUP: genomic best linear unbiased prediction, BA: Bayes A, RKHS: reproductive Kernel Hilbert space, EGBLUP: epistatic GBLUP, RF: random forest. The box are interquartile limits, dashed traits the 95% distribution and ° the outliers.

