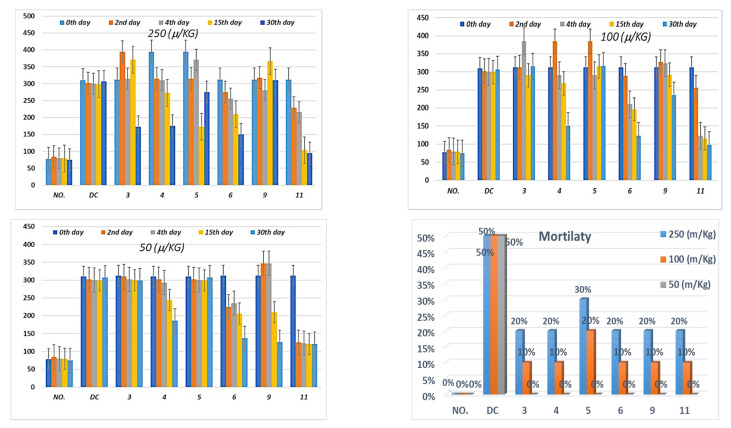
Figure 6.
Antidiabetic effect and percent of mortality in three different concentration 50, 100, and 250 (μ/Kg) at 0th day (pre-drug values), 2nd and 4th day (post-drug values) for each group of compounds (3–6, 9, 11) compared to diabetic-control “DC” and normal control “NO”. Data analyzed by one way ANOVA followed by LSD test and expressed as mean ± SEM from five observations.

