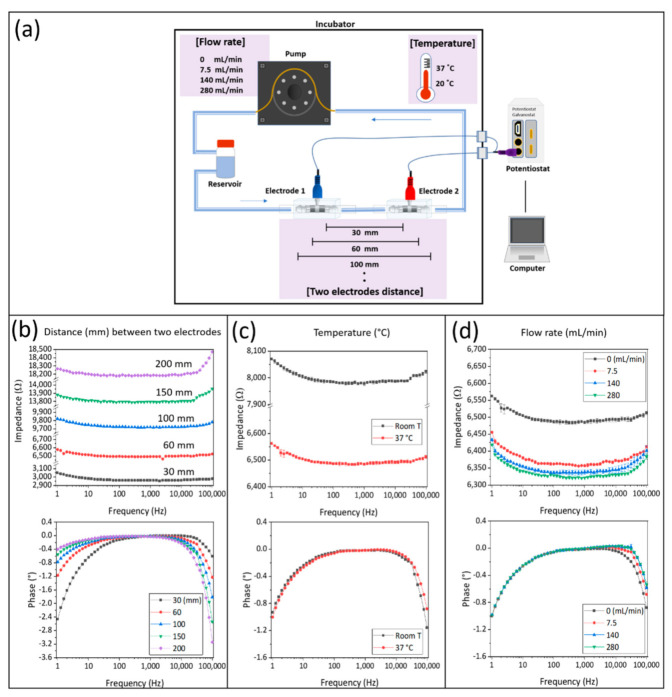
Figure 5.
Characterization of electrical properties of the TiN tube electrodes. (a) A graphical image of electrochemical cell set up and test conditions for TiN tube electrode characterization. Bode blots of the recorded impedance spectra over the frequency, depending on (b) the distance between two electrodes at 30, 60, 100, 150, and 200 mm; (c) the temperature at RT (approximately 20 °C) and 37 °C, as well as (d) different flow rates of 0, 7.5, 140, and 280 mL/min.

