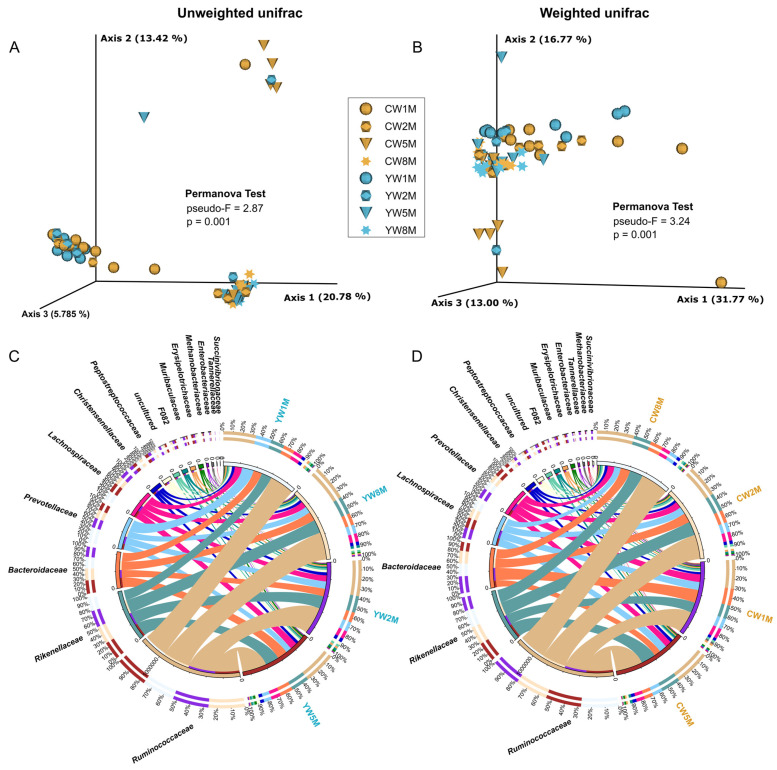
Figure 3.
Beta diversity analysis of the fecal microbial community in yak and cattle calves at different months after weaning. (A) PCoA plot based on unweighted unifrac distance shows the differences between yak and cattle calves in different months after weaning. (B) PcoA plot based on weighted unifrac distance shows the differences between yak and cattle calves in different months after weaning. Circos diagram shows the composition of fecal microbiota at the family level (Top15) of yak (C) and cattle calves (D) in different months after weaning, respectively. The length of the bars on the outer ring and the numbers on the inner ring represent the percentage of relative abundance of genera detected in each sample and the number of sequences in each sample, respectively. The bands with different colors show the source of each sequence affiliated with different clusters.

