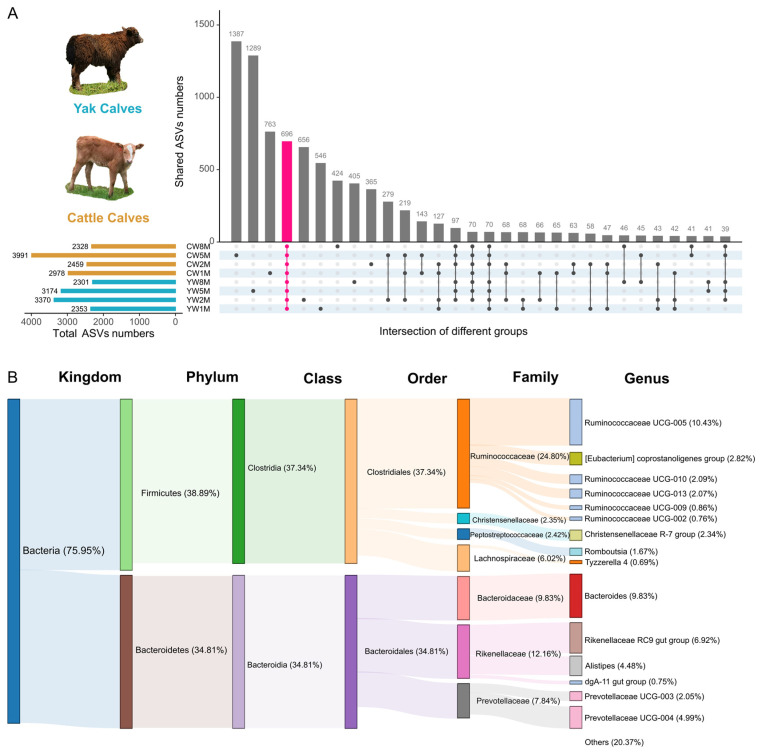
Figure 4.
Analysis of the core fecal microbial community between yak and cattle calves in different months after weaning. (A) UpSet plots of common ASVs in fecal samples from yak and cattle calves in different months after weaning. The vertical bars or intersections represent the number of ASVs that were regulated by one or more samples type (intersecting conditions). The ASVs in each intersection were color-coded according to the meaning of their set. (B) Sankey diagram based on 696 shared ASVs at different taxonomic levels.

