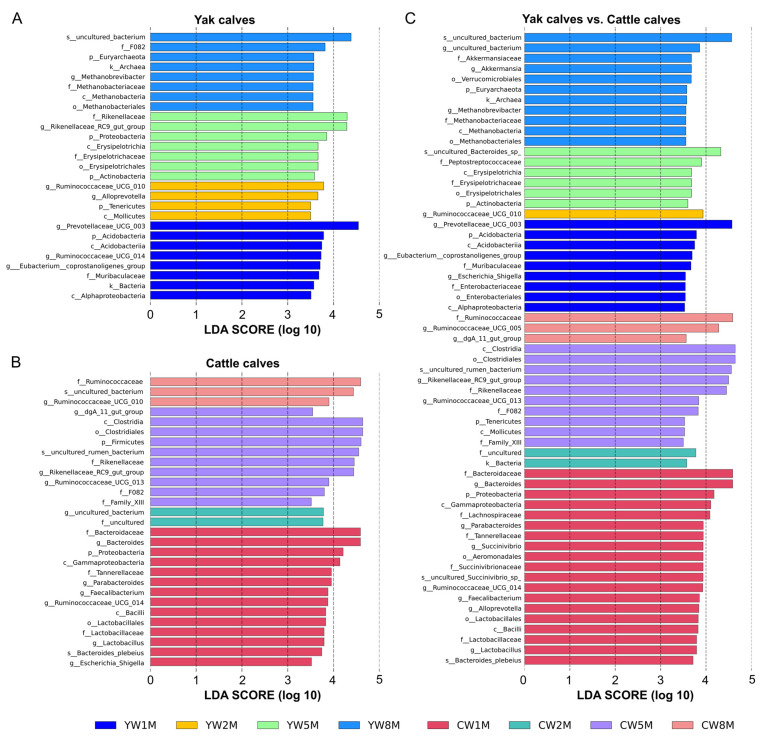
Figure 5.
LEfSe analysis based on bacterial abundance data. LDA effect size (LDA score) comparison of fecal microbiota in yak calves (A), cattle calves (B), and between yak and cattle calves (C). The LDA cut-off score is 3.5. Letters in front of ASVs represent taxonomic levels (p, phylum; c, class; o, order; f, family; g, genus; s, species). The bar chart shows the different species in the fecal microbiota of calves in different months after weaning. Different colors represent different months after weaning.

