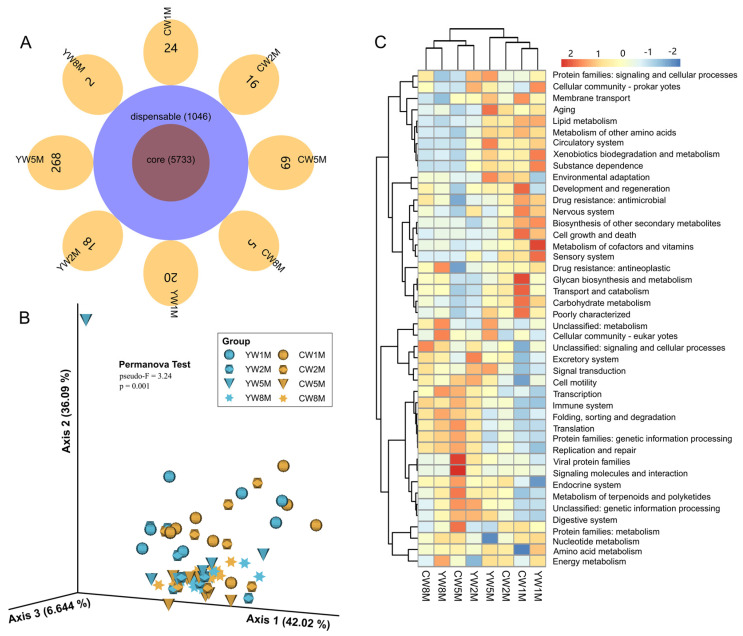
Figure 6.
Prediction of potential functions of the fecal microbial community in weaned calves using PICRUSt2. (A) Veen diagram shows the sharing of microbial functional genes. (B) PCA plot shows microbial functional diversity across all fecal samples. (C) The heat map shows the differences in fecal microbial functions of yak and cattle in different months after weaning based on KEGG level 2 annotation.

