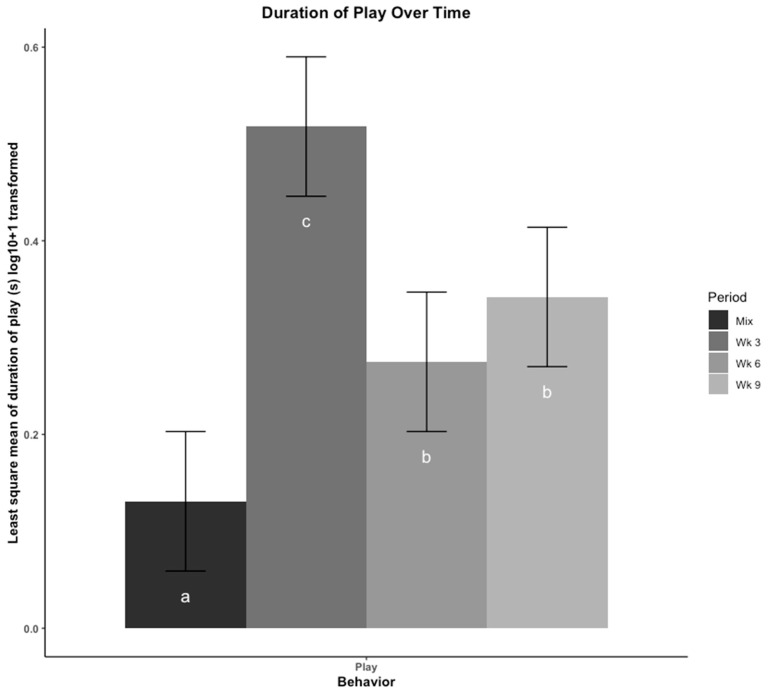
Figure 4.
Play was compared across four time points using least square means regression analysis. Play was recorded in duration (seconds (s)) and log10 + 1 transformed. The four time points are: immediately after mix, and 3, 6, 9 weeks (wk) after mix. Observations at 6 wk were made after pigs were moved to a new pen with their group. Play is presented as total duration (s). Errors bars represent the 95% confidence interval of the least square means. a–c: Bars with different letters denote time periods that showed different frequencies of play behavior (p < 0.05, Tukey, HSD adjusted).

