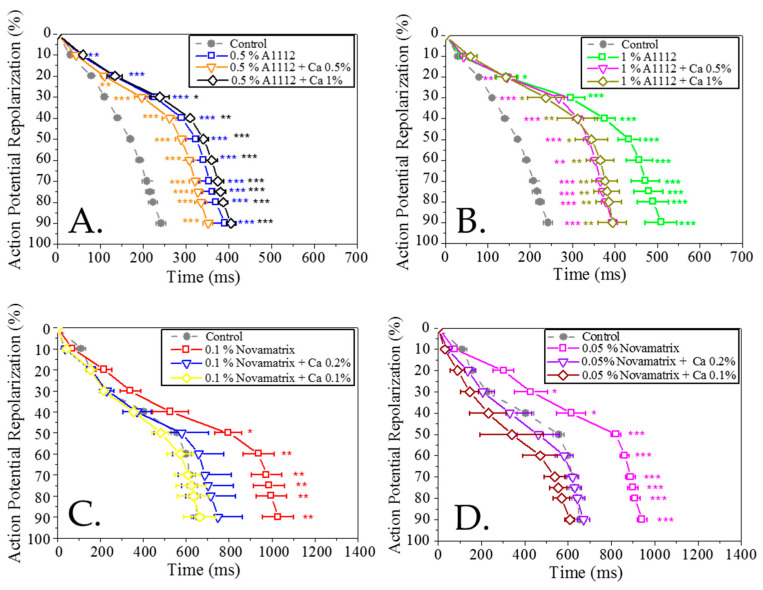
Figure 6.
Analysis of the repolarisation profile of cardiomyocytes exposed to varying concentrations of two different alginates (A1112 and Novamatrix) with and without calcium chloride compared to a control: (A) 0.5% A1112 and calcium chloride (0%, 0.5%, 1%); (B) 1% A1112 and calcium chloride (0%, 0.5%, 1%); (C) 0.1% Novamatrix and calcium chloride (0%, 0.1%, 0.2%); (D) 0.05% Novamatrix and calcium chloride (0%, 0.1%, 0.2%). Data presented as mean ± SEM (n = 5). The statistical analysis was done the post-hoc Dunnet test * p < 0.05; ** p < 0.01; *** p < 0.001.

