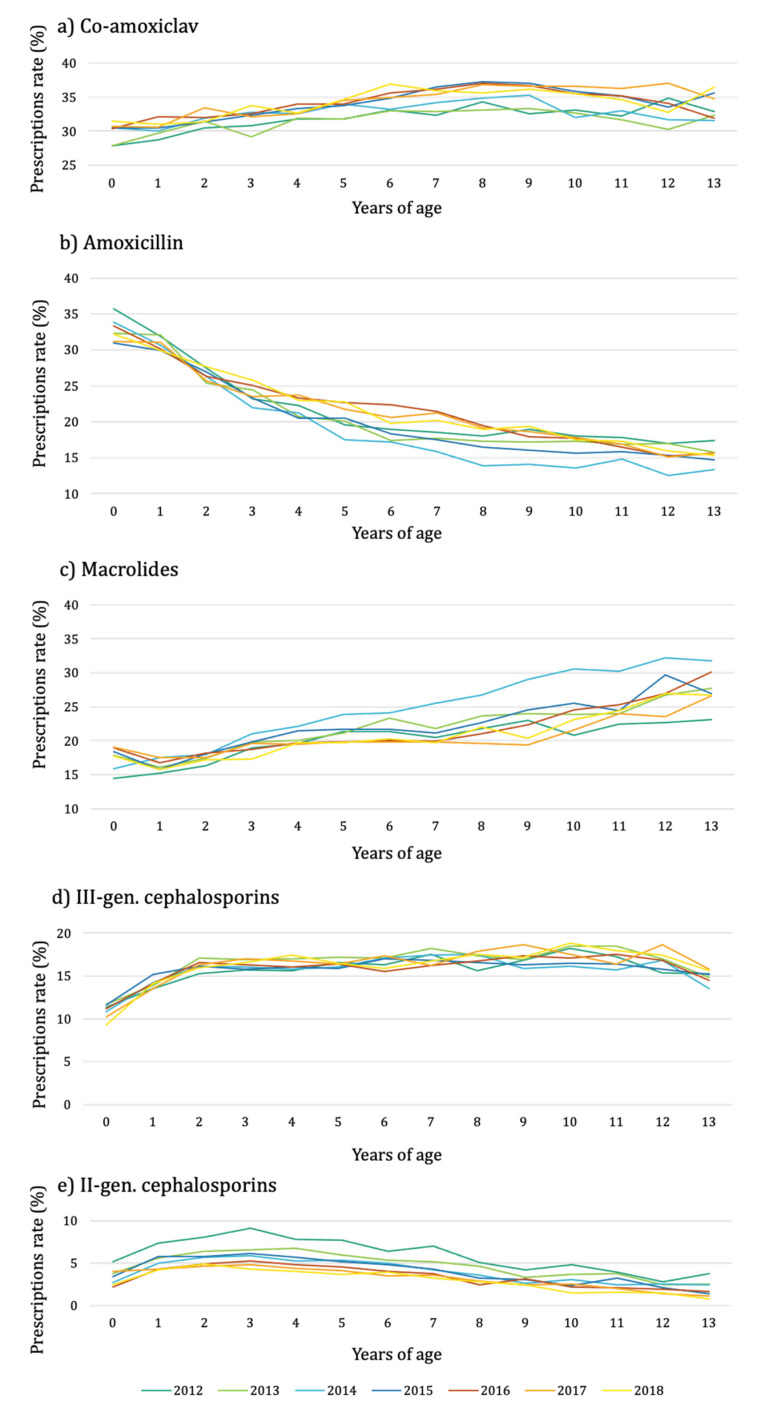
Figure 3.
Antibiotic prescription rate stratified by years of age, antibiotic class (co-amoxiclav, Panel (a); amoxicillin, Panel (b); macrolides, Panel (c); third-generation cephalosporins, Panel (d); second-generation cephalosporins, Panel (e)), and calendar year, 2012–2018. Only antibiotic classes with a prescription rate value greater than 5% are reported.

