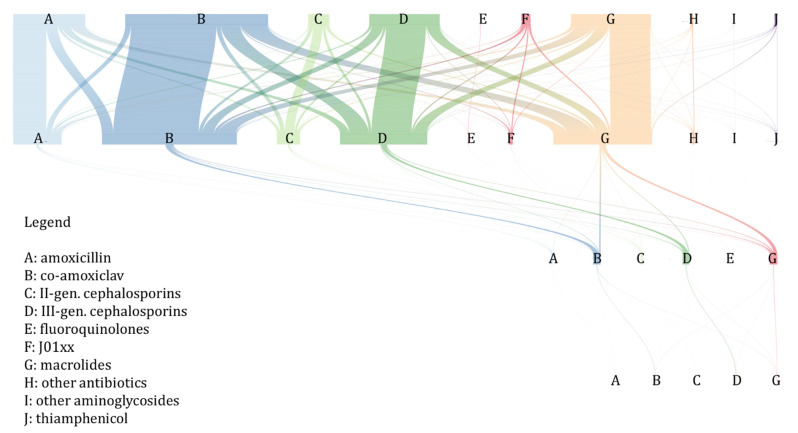
Figure 6.
River plot of antibiotic treatment switching and prolongation. The rows of letters represent the prescriptions grouped by antibiotic classes in timely order from the upper part (first prescription) to the bottom part (last prescription), and the coloured lines show the connection with the following prescriptions in the same treatment episode (Pedianet, 2012–2018).

