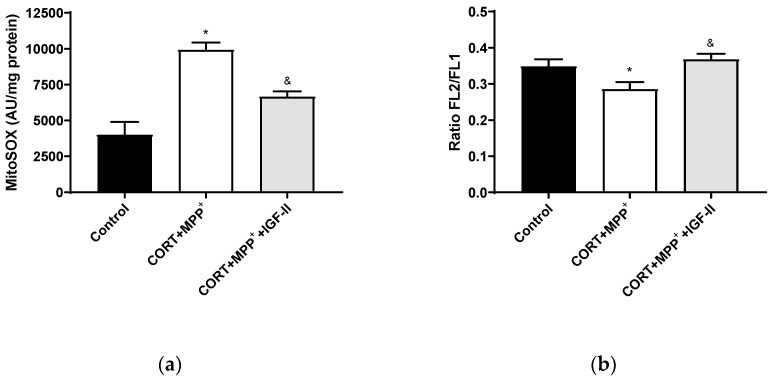
Figure 3.
Mitochondrial markers in SN4741 neuronal cells after 2.5 h of incubation with the combination of corticosterone and MPP+ (CORT + MPP+) in the presence or absence of IGF-II. (a) Mitochondrial levels of ROS; (b) cytofluorometric analysis of mitochondrial membrane potential (mΔΨ). Data were combined from three to four independent experiments and presented as mean ± SEM. * p < 0.05 compared to control cells; & p < 0.05 compared with CORT + MPP+ co-incubated cells.

