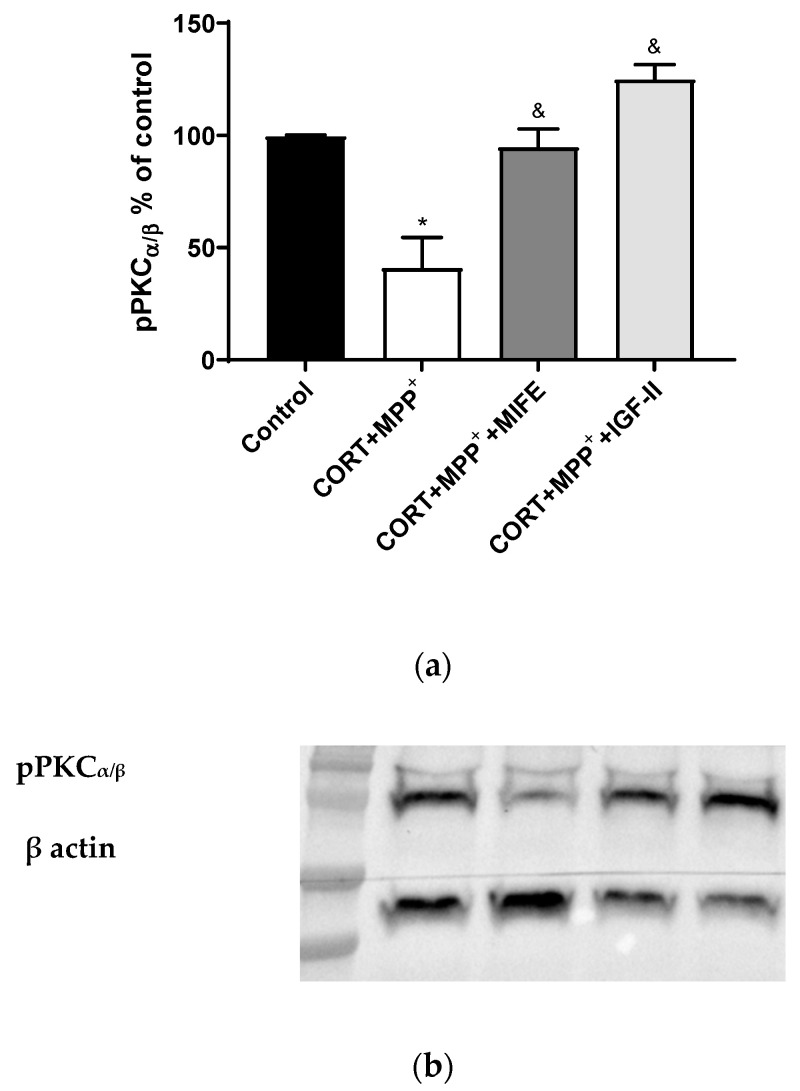
Figure 6.
Study of PKCα expression in SN4741 neuronal cells after 2.5 h of incubation with the combination of corticosterone and MPP+ (CORT + MPP+) in the presence or absence of IGF-II. (a) Quantification after normalising with β actin; (b) Representative Western blot. Data from two independent experiments were combined and presented as mean ± SEM; each situation in each experiment carried out included three independent experiments with three samples in each one; * p < 0.05 compared to control cells; & p < 0.05 compared to CORT + MPP+ co-incubated cells.

