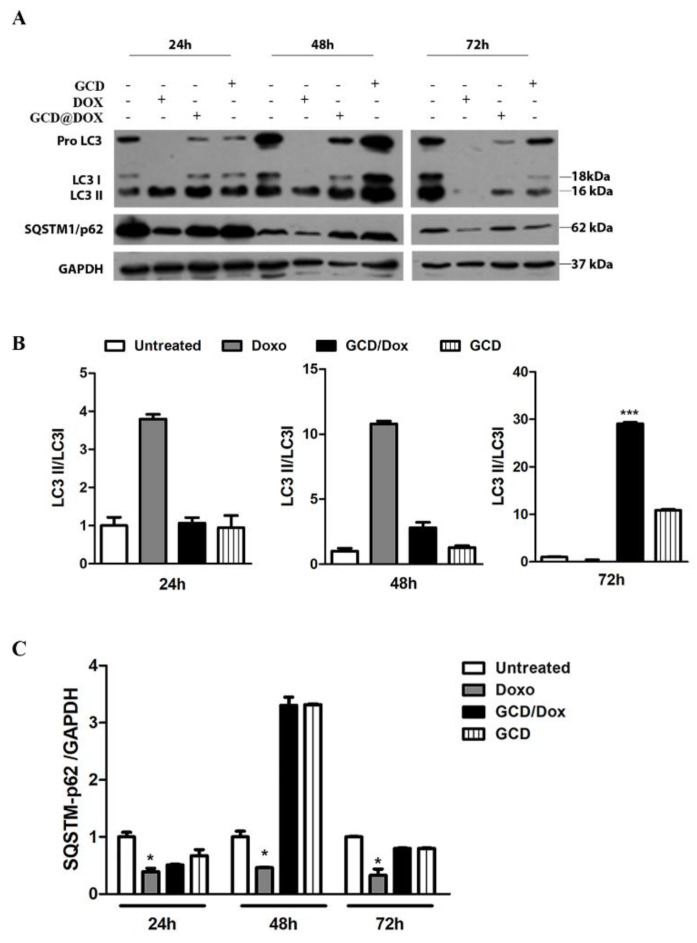
Figure 5.
Parallel monitoring of LC3-I, LC3-II and SQSTM-p62 autophagy-related protein expression in HEp-2 cells treated with GCD@DOX and DOX. (A) Immunoblot and quantification of LC3-I, LC3-II and SQSTM-p62 in HEp-2 cells untreated or treated with GCD@DOX, DOX and GCD for the indicated times. (B,C) The graphs show (mean ± SD) LC3-II/LC3-I ratios of each treatment normalised to the LC3-II/LC3-I ratio of control-untreated cells for each experiment. Statistical significance was tested by one-way ANOVA analysis assay in triplicate. *** p < 0.001 and * p < 0.05 indicate significant changes vs. control.

