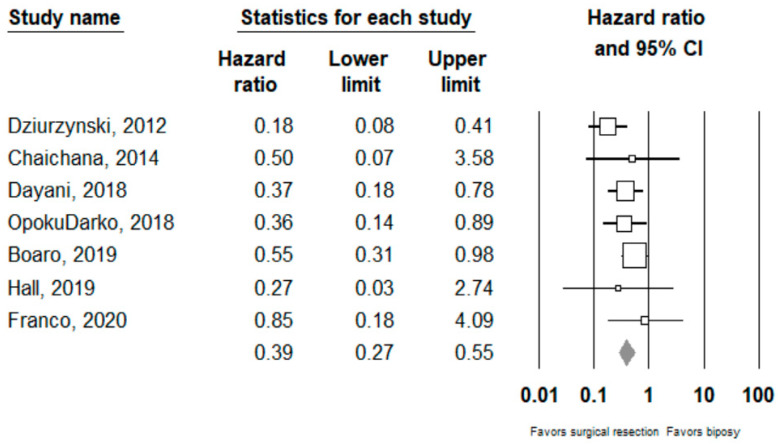
Figure 2.
Forest plots showing hazard ratios of surgery vs biopsy for overall survival. Each study is shown by the point estimate of the hazard ratio and 95% confidence intervals (extending lines). The diamond center represents the estimated pooled hazard ratio and the width represent its 95% confidence interval (labelled total).

