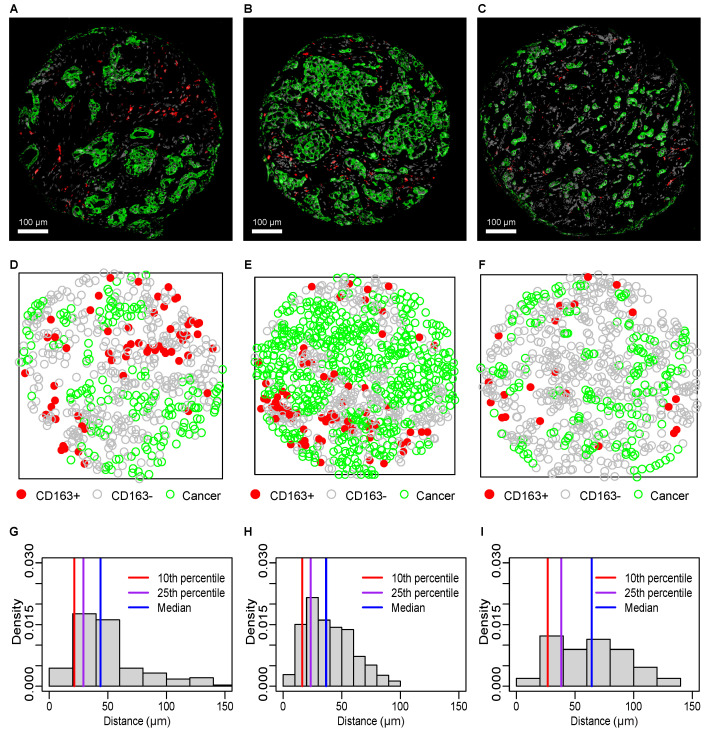
Figure 2.
Spatial analysis of CD TAMs and cancer cells in breast cancer. IF-IHC images ((A–C); cancer cells green, CD TAMs red) with corresponding marked point patterns (D–F) of CD TAMs (red), cells (grey), and cancer cells (green), and nearest neighbor distance (NND) distributions (G–I) for cancer cells to the nearest CD TAM.

