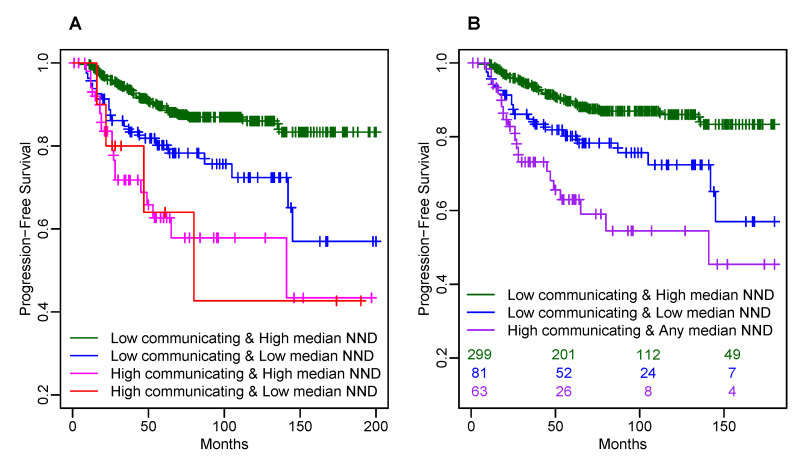
Figure 4.
Kaplan–Meier plots of PFS by combined CD TAM marker based on high vs. low average number of communicating CD cells and high vs. low median NND. (A) by four combinations of low/high average number of communicating CD cells and low/high median cancer-to-CD NND; (B) by combined CD163 marker with 3 categories: (1) low average number of communicating CD cells and high median cancer-to-CD NND; (2) low average number of communicating CD cells and low median cancer-to-CD NND; (3) high average number of communicating CD cells and any median cancer-to-CD NND.

