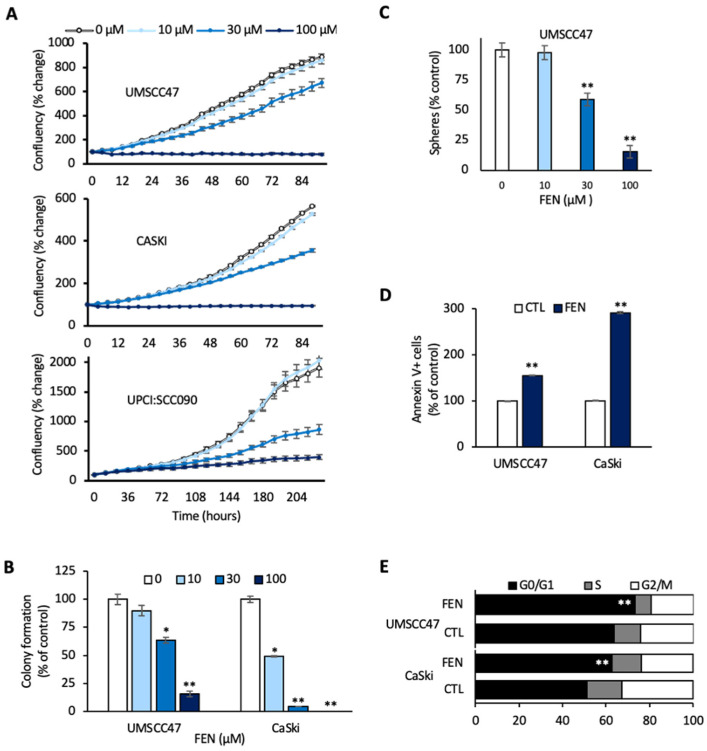
Figure 5.
Fenofibrate induces a global anti-cancer effect. (A) Cell proliferation. UMSCC47, UPCI:SCC090, and CaSki cell lines were treated with control or fenofibrate. Cell proliferation was measured using the IncuCyte live cell imaging system. Data are represented as mean ± SEM. (B) Colony formation assay. Colony counts are shown as a percentage of control for the indicated doses of fenofibrate. * p < 0.05; ** p < 0.01. (C) Tumorsphere formation assay. Tumorsphere counts are shown as a percentage of control for the indicated doses of fenofibrate. ** p < 0.01. (D) Apoptosis assay. Percentage of Annexin V+ cells following control or fenofibrate treatment, ** p < 0.01. (E) Cell cycle analysis. Black, gray, and white bars indicate the percentage of the total population in each cell cycle phase in response to control or fenofibrate treatment, ** p < 0.01.

