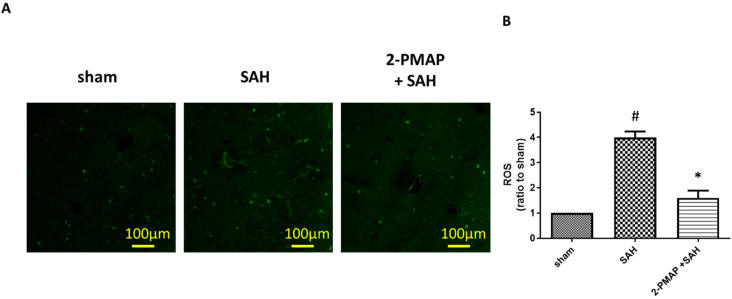
Figure 7.
2-PMAP decreased reactive oxygen synthase (ROS) in SAH rats. Slices of brain tissues were prepared in rats treated with the administration of 2-PMAP, or not, 48 h after the SAH. Immunofluorescence staining showing ROS elevated in brain tissues after SAH. (A) Representative images of ROS in the brain tissues. Scale bars: 100 μm. (B) Relative fluorescence intensity of ROS. Data are shown as mean ± SD (n = 6 for each group). *, p < 0.05, significantly different from the SAH group. #, p < 0.05, significantly different from the sham group.

