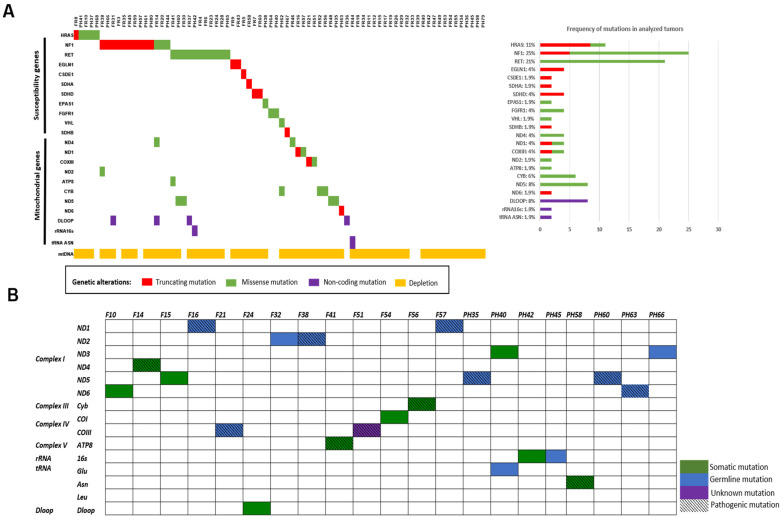
Figure 1.
Mutation’s analysis. (A) OncoPrint summarizing the distribution of nuclear and mitochondrial pathogenic mutations, and mitochondrial depletion in PCC/PGL tumors with total mutation frequencies. The OncoPrint showed an overview of genomic alterations (legend) in particular genes (rows) affecting individual samples (columns). The truncated, missense, and non-coding mutations are shown in red, green, and purple, respectively. Mitochondrial depletion is shown in yellow. (B) Summary of 21 novel gene mutations detected in 20 cases of PCCs/PGLs from France and Sweden; germline mutations are denoted by green color; somatic mutations are denoted by blue color, unknown mutations are denoted by purple color, and pathogenic mutations are denoted by hatch mark.

