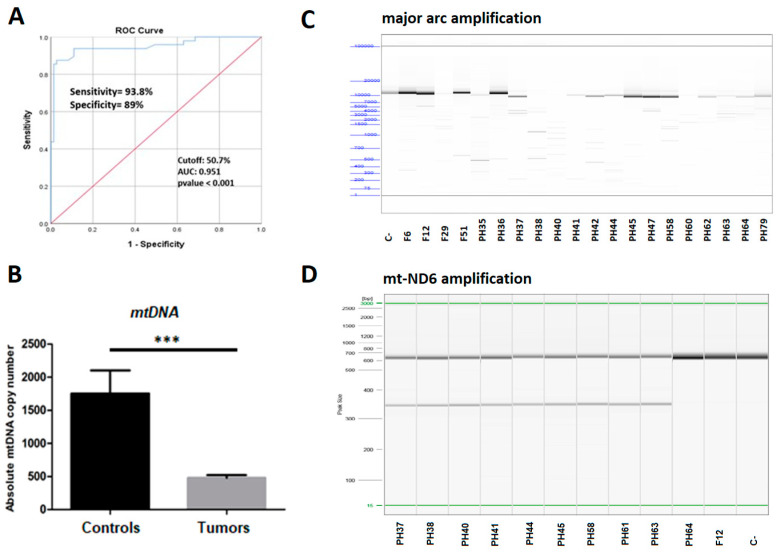
Figure 3.
Mitochondrial DNA depletion and large deletions analysis. (A) ROC curve to assess the optimal cutoff value of mitochondrial DNA copy number (51%). AUC, area under the curve; ROC, receiver operating characteristic. (B) Absolute mtDNA copy number in the PCCs/PGLs (Swedish and French cohorts) and controls (normal adrenal medulla tissues); p-values were calculated by t-test, *** <0.0001. (C) Large mitochondrial DNA deletions detected in PCCs/PGLs from the Swedish and the French cohort, using the Fragment Analyzer. (D) Gel electrophoresis separation of a 300 bp heteroplasmic deletion detected in MT-ND6 gene, using QIAxcel (Qiagen) in 9 tumors from the Swedish cohort (right). (C-: negative control yielded the expected band size.)

